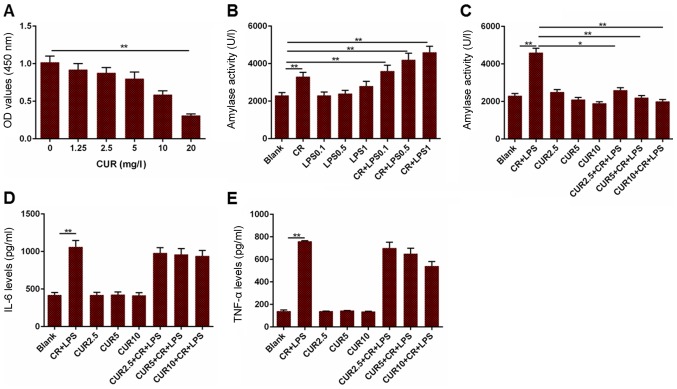
Figure 3.
Measurement of cell viability, amylase activity, and levels of IL-6 and TNF-α in a cell model of AP. (A) OD values in cells treated with different concentrations of CUR. (B) Amylase activity in cells treated with different combinations CR and LPS to establish a cell model of AP. (C) Amylase activity in the cell model of AP treated with different concentrations of CUR. (D) IL-6 levels in the cell model of AP treated with different concentrations of CUR. (E) TNF-α levels in the cell model of AP treated with different concentrations of CUR. *P<0.05, **P<0.01. IL-6, interleukin 6; TNF-α, tumor necrosis factor-α; OD, optical density; CUR, curcumin; CR, cerulein; LPS, lipopolysaccharide; AP, acute pancreatitis.

