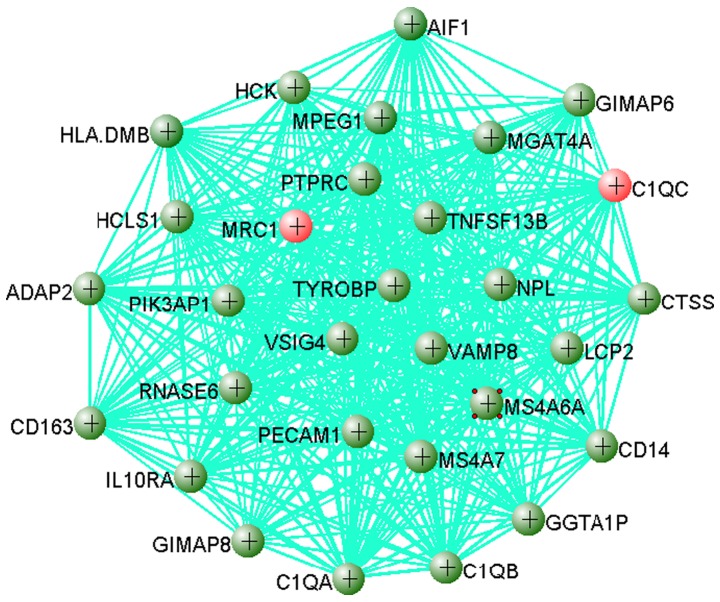
Figure 5.
Gene-gene interaction network of the top 30 genes in the yellow module visualized using VisAnt software. Red circle indicate that the gene is overexpressed in OS while green circles indicate that the expression of this gene is unchanged. The small red circles around MS4A6A indicate that there are more connections to this gene. OS, osteosarcoma.

