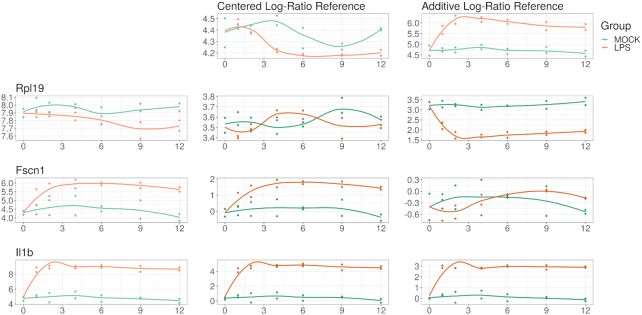
Figure 2:
This figure illustrates how the interpretation of differential abundance depends on the reference chosen. On the left margin, we show the log-abundance of 3 genes (RPL19, FSCN1, and IL1B) for the LPS-treated cells (orange) and control (blue). For compositional data, these abundances carry no meaning in isolation because the constrained total imposes a “closure bias.” On the top margin, we show the log-abundance of 2 references: the geometric mean of the samples (a la the clr) and a hypothesis-based reference NFκB (a la the alr). In the middle, we show the abundance of the log-ratio of the left margin feature divided by the top margin reference (equivalent to left margin minus top margin in log space). RPL19 alone appears more abundant in the control but actually has equivalent expression when compared with the geometric mean; however, it has significantly higher expression in the control relative to NFκB. On the other hand, FSCN1 alone appears more highly expressed in the LPS-treated cells, which remains true when compared with the geometric mean; however, it has equivalent expression relative to NFκB (interpreted as NFκB and FSCN1 expression changing similarly in response to LPS stimulation). IL1B alone appears more highly expressed in the LPS-treated cells, which remains true when compared with the geometric mean and with NFκB (interpreted as IL1B expression becomes even higher than NFκB expression in response to LPS stimulation). Choosing a reference makes normalization unnecessary but requires a shift in interpretation.

