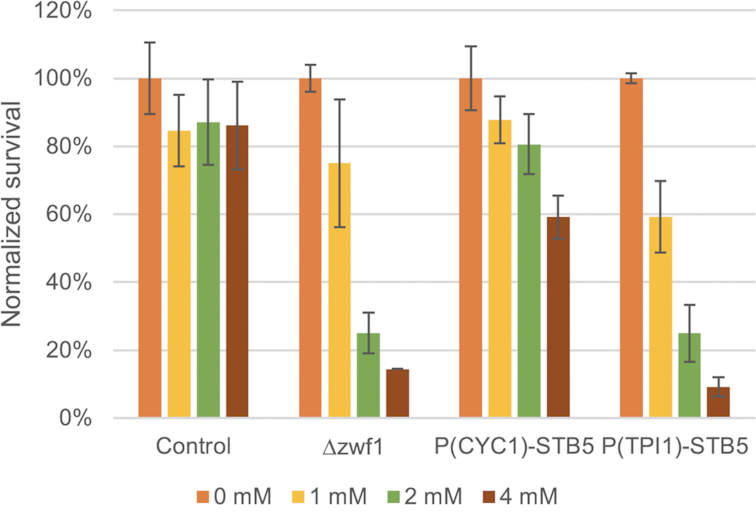
Figure 2.

Survival of the strains CEN.PK 113–5D, zwf1∆ and PCYC1-STB5 and PTPI1-STB5 after liquid H2O2-shock. The values indicate the proportion of surviving cells at each concentration compared to the value observed for each strain at 0 mM H2O2. Values are averages of two biological and two technical replicates; error bars represent ± standard deviation.
