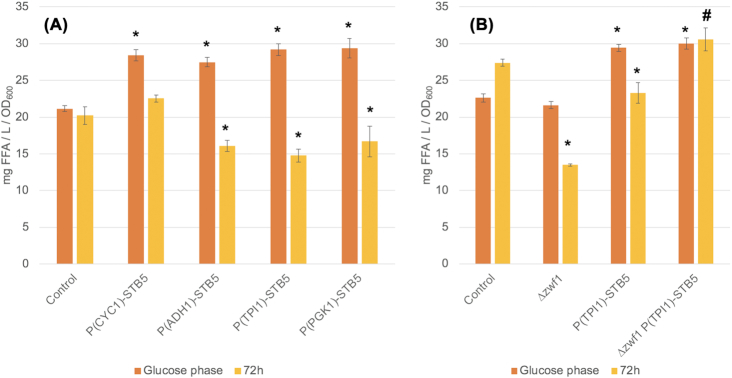
Figure 3.
FAA quantification of CEN.PK 113–5D faa1∆faa4∆ strains after glucose was depleted (Glucose phase) and at stationary phase (72 h). A) Influence of different levels of STB5 overexpression on FA synthetic ability. B) Influence of ZWF1 deletion on FA synthetic ability in the control and PTPI1-STB5 strain (# indicates that the strain failed to consume the produced ethanol). Strains were grown in minimal medium with 2% glucose with the addition of 60 mg/L uracil. Values are averages of three biological replicates, error bars ± standard deviation. Asterisks (*) indicate a significant change from the control (P < 0.05; Student´s t-test, two-sided) at the corresponding sampling point.

