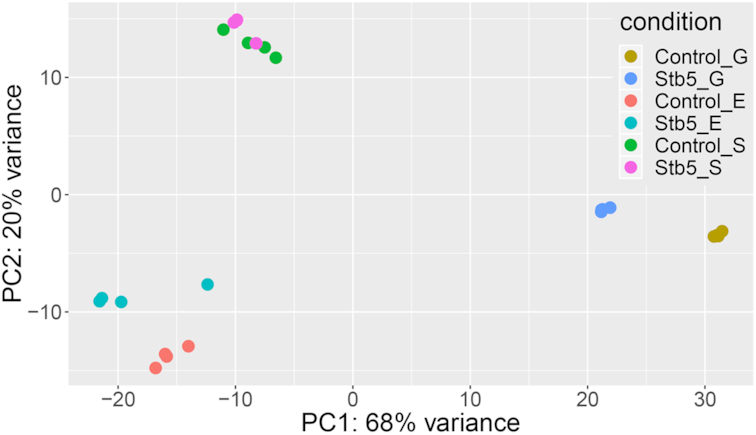
Figure 5.

Principal component analysis plot of RNAseq data from control and STB5 overexpression strain. ’Control’ and ‘Stb5’ indicate the control CEN.PK-113 5D and STB5 overexpression strain AB15, respectively, while G, E and S correspond to the sampling point condition (Glucose, Ethanol and Steady state, respectively).
