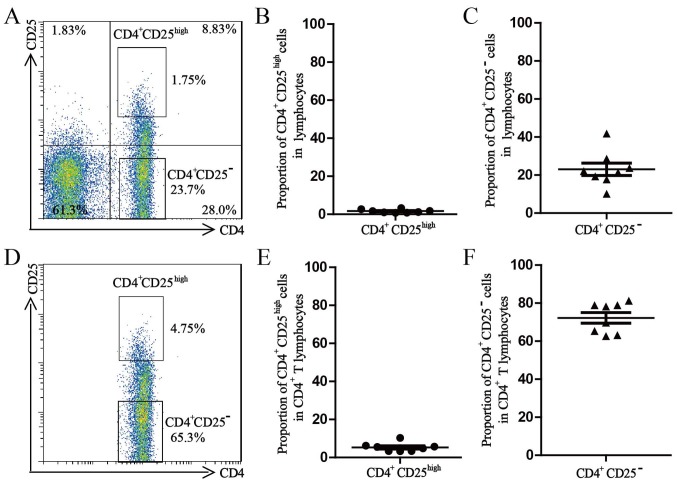
Figure 1.
Percentage of CD4+CD25high Treg and CD4+CD25− effector T cells. (A) Representative dot plots for the percentage of CD4+CD25high Treg and CD4+CD25− effector T cells in the lymphocyte population in PBMCs of a healthy donor. (B) Percentages of CD4+CD25high Treg cells in the lymphocyte populations. (C) Percentages of CD4+CD25− effector T cells in the lymphocyte populations. (D) Representative dot plots for the percentage of CD4+CD25high Treg and CD4+CD25− effector T cells in the CD4+ T lymphocyte population in PBMCs from a healthy donor. (E) Percentages of CD4+CD25high Treg in the CD4+ T lymphocyte populations in PBMCs of healthy donors. (F) Percentages of CD4+CD25− effector T cells in the CD4+ T lymphocyte populations in PBMCs from healthy donors. All values are expressed as the mean ± standard error of the mean (n=8). PBMCs, peripheral blood mononuclear cells; Treg cells, T-regulatory cells.

