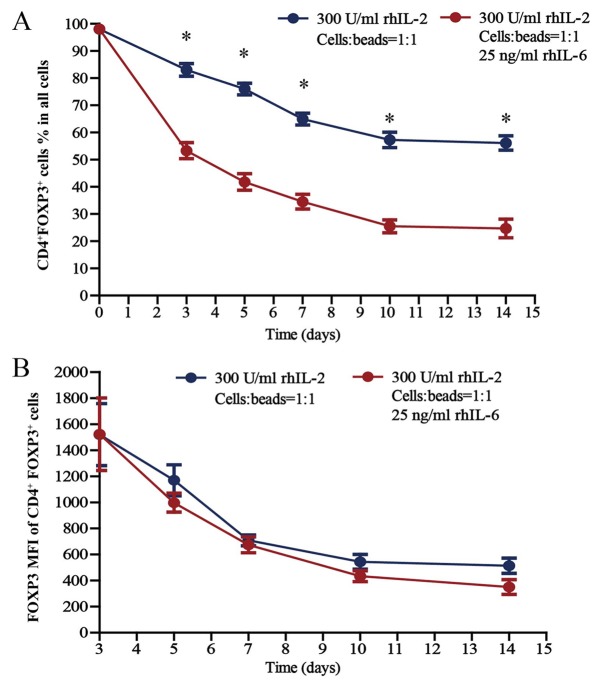
Figure 4.
Proportion of CD4+FoxP3+ Treg cells in all cell populations under inflammatory conditions. Percentages of CD4+FoxP3+ Treg cells among (A) all cell populations and (B) the FoxP3 MFI of CD4+FoxP3+ Treg cells after culture for 3, 5, 7, 10 and 14 days in the presence of rhIL-2 (300 U/ml) and anti-CD3/CD28 beads (Treg cells/beads, 1:1), with or without 25 ng/ml rhIL-6. Unpaired Student's t-test was used to compare differences between groups without and with rhIL-6. Values are expressed as the mean ± standard error of the mean (n=8). *P<0.05 vs. Treg cells cultured with rhIL-6. MFI, mean fluorescence intensity; Treg cells, T-regulatory cells; FoxP3, forkhead box P3; rhIL, recombinant human interleukin.

