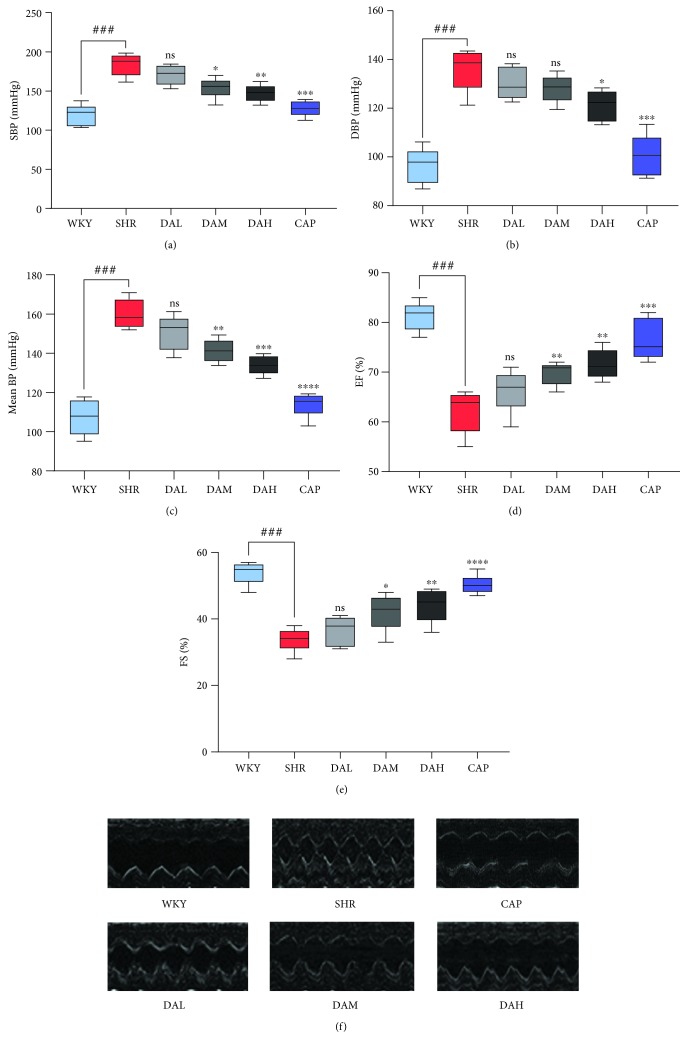
Figure 1.
Effects of DA treatment on blood pressure and cardiac function during administration for 12 consecutive weeks: (a) SBP; (b) DBP; (c) MBP; (d) EF; (e) FS; (f) image of ultrasound cardiogram. n = 7. ###P < 0.001 vs. WKY, ##P < 0.01 vs. WKY, and #P < 0.05 vs. WKY; ∗∗∗P < 0.001 vs. SHR, ∗∗P < 0.01 vs. SHR, and ∗P < 0.05 vs. SHR.

