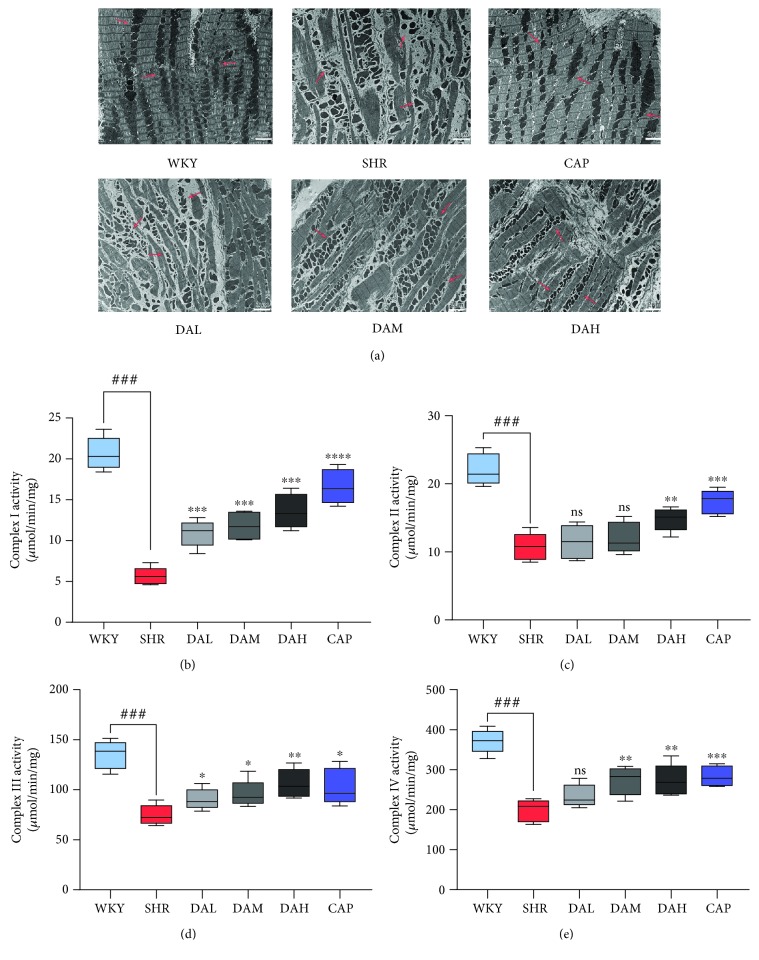
Figure 5.
Changes in mitochondrial morphology and mitochondrial complex activity. (a) Ultrastructural analysis of myocardium under 8000x magnification and the areas of the mitochondrion were marked by the black arrow. (b–e) Maximal activities of complexes I-IV in cardiac mitochondria. ###P < 0.001 vs. WKY, ##P < 0.01 vs. WKY, and #P < 0.05 vs. WKY; ∗∗∗P < 0.001 vs. SHR, ∗∗P < 0.01 vs. SHR, and ∗P < 0.05 vs. SHR.

