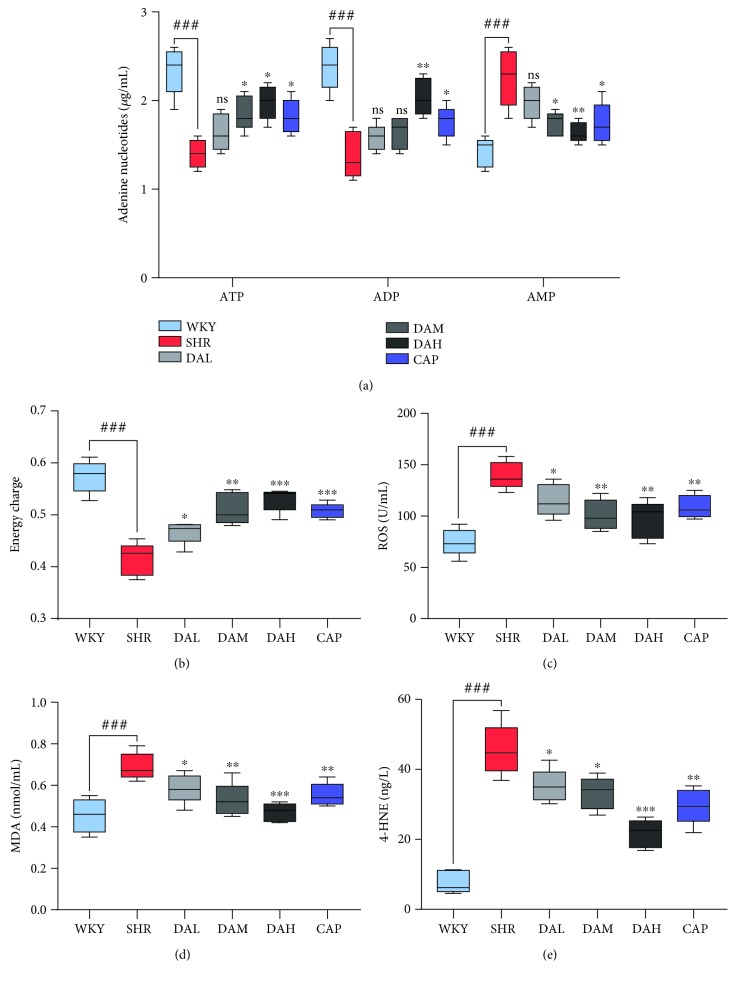
Figure 6.
(a, b) ATP, ADP, and AMP concentrations and energy charge in the myocardium. (c–e) Oxidative stress indexes of MDA, ROS, and 4-HNE concentrations in the myocardium. ###P < 0.001 vs. WKY, ##P < 0.01 vs. WKY, and #P < 0.05 vs. WKY; ∗∗∗P < 0.001 vs. SHR, ∗∗P < 0.01 vs. SHR, and ∗P < 0.05 vs. SHR.

