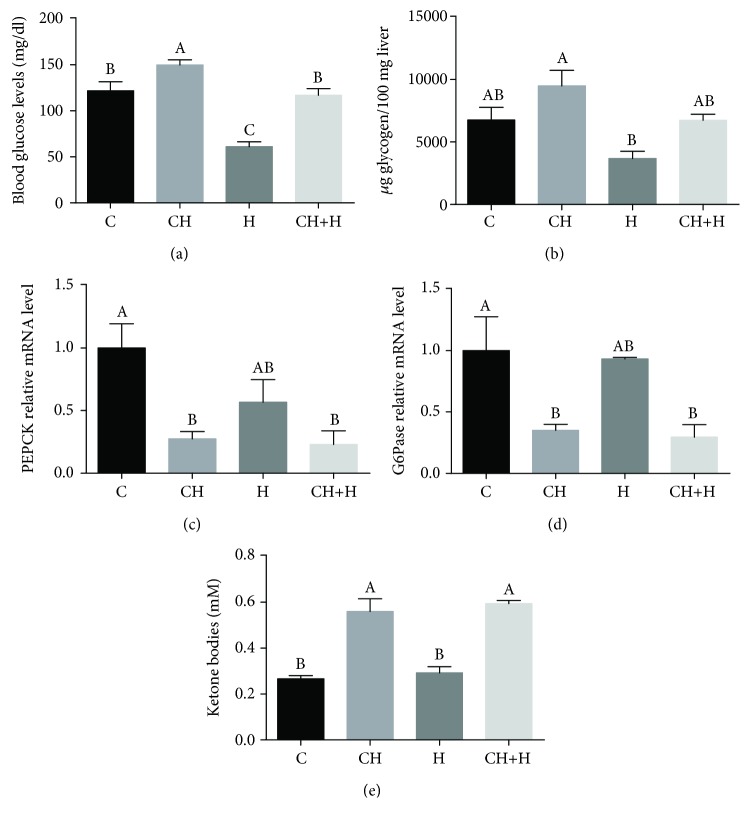
Figure 3.
Effect of CH diet (CH), hypoxia (H), or their combination (CH+H) compared to the control (C) on (a) blood glucose levels, (b) liver glycogen content, (c) liver mRNA levels of PEPCK, (d) liver mRNA levels of G6Pase, and (e) liver ketone body levels. Values are expressed as means ± SE (n = 8–10 for each group). Means with different letters are statistically different, P < 0.05.

