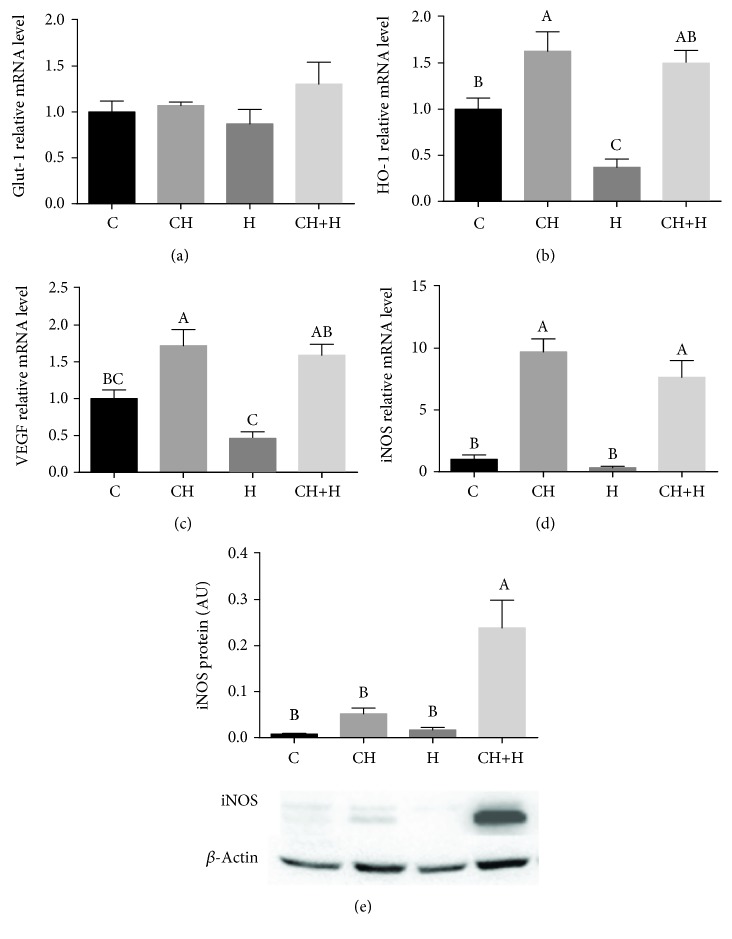
Figure 6.
Effect of CH diet (CH), hypoxia (H), or their combination (CH+H) compared to the control (C) on liver mRNA levels of (a) Glut-1, (b) HO-1, (c) VEGF, and (d) iNOS and on (e) iNOS protein expression levels. Values are expressed as means ± SE (n = 8–10 for each group). Means with different letters are statistically different, P < 0.05.

