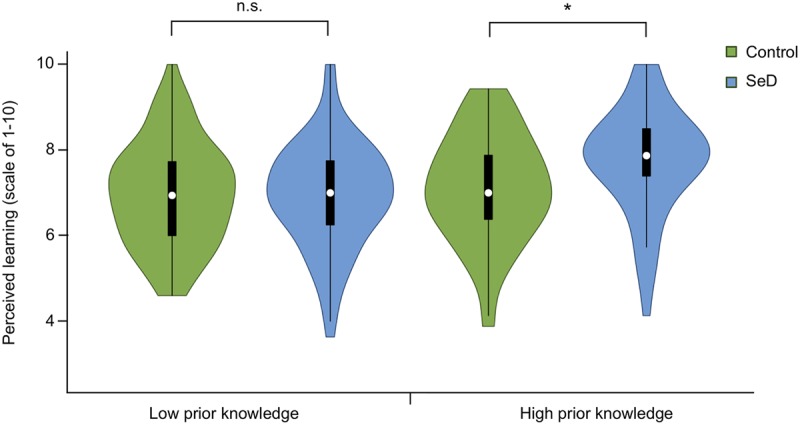
FIGURE 3.

Violin plots showing perceptions of learning in students with low vs. high levels of self-reported prior knowledge. White circles show the medians; box limits indicate the 25th and 75th percentiles as determined by R software; whiskers extend 1.5 times the interquartile range from the 25th and 75th percentiles; polygons represent density estimates of data and extend to extreme values. Significant differences (p < 0.05) are denoted with an asterisk. SeD, seductive details. n.s., not significant; *, p = 0.006
