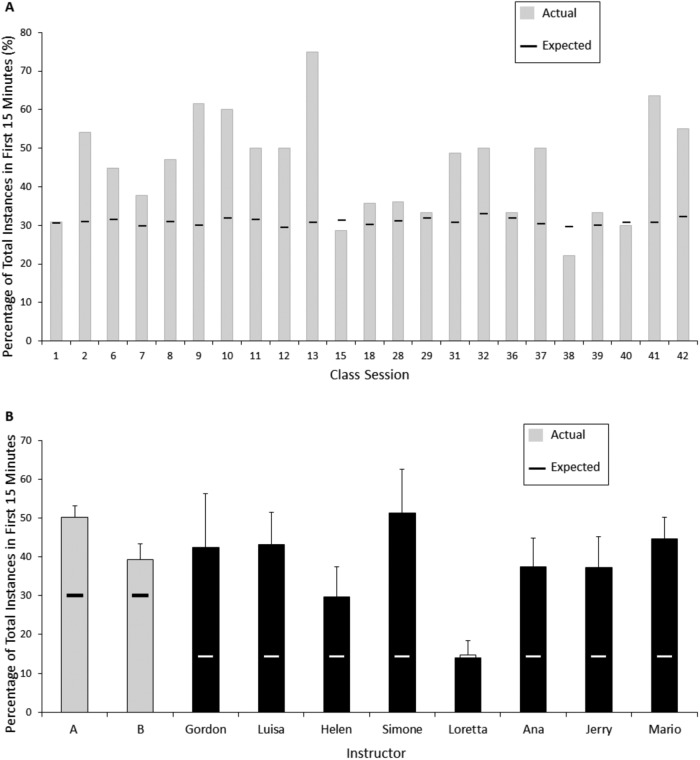
FIGURE 6.
Developing a strategy to sample Instructor Talk by evaluating representation of Instructor Talk in the first 15 minutes of class sessions. (A) The percentage of Instructor Talk instances that would be expected in the first 15 minutes of each 50-minute class session (black lines; assuming uniform distribution of Instructor Talk) is compared with the actual percentage present in the 15-minute sample from the beginning of each class session (light gray bars) for the 23 class sessions in the original Instructor Talk study (Seidel et al., 2015). While the course met for 50-minute class sessions, the expected Instructor Talk was calculated based on the specific minutes of recording for each particular class session. (B) Similarly, the average percentage of Instructor Talk instances that would be expected in the first 15 minutes of courses with either 50- or 90-minute class sessions (black or white lines; assuming uniform distribution of Instructor Talk) is compared with the actual average percentage present in the 15-minute samples from the beginning of each class session for Instructors A and B from the original Instructor Talk study (light gray bars; Seidel et al., 2015) and for the instructors of the eight courses in the whole-course analysis (black bars).

