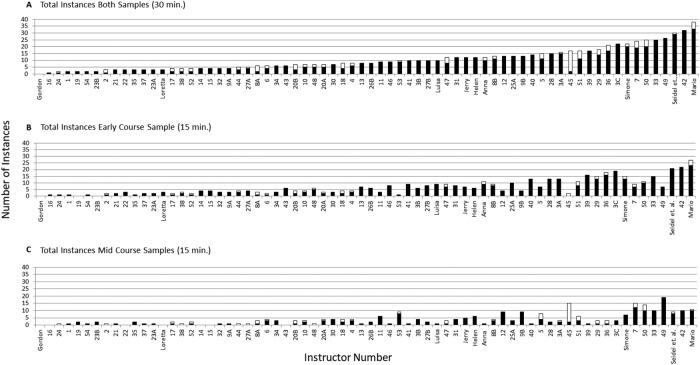
FIGURE 7.
Profile of Instructor Talk present in two, 15-minute samples across 61 courses. (A) The total number of Instructor Talk instances across two, 15-minute samples (both early-course and midcourse samples combined) for 53 instructors in the sampled data set (numbers), eight instructors from the whole-course data set (pseudonyms), and the original Instructor Talk study (Seidel et al., 2015). Each bar represents the number of instances per individual instructor of Positively Phrased Instructor Talk (black) and Negatively Phrased Instructor Talk (gray). Instructors are ordered by total number of Instructor Talk instances observed in the combined samples. Instructors with multiple courses in this analysis were given a letter designation after their numbers to identify different courses. (B) Number of Instructor Talk instances found for each instructor only in the early-course sample, which was the first 15 minutes of the first class session recorded. (C) Number of Instructor Talk instances found for each instructor only in the midcourse sample, which was the first 15 minutes of a midterm class session ∼8 weeks later.

