Figure 2.
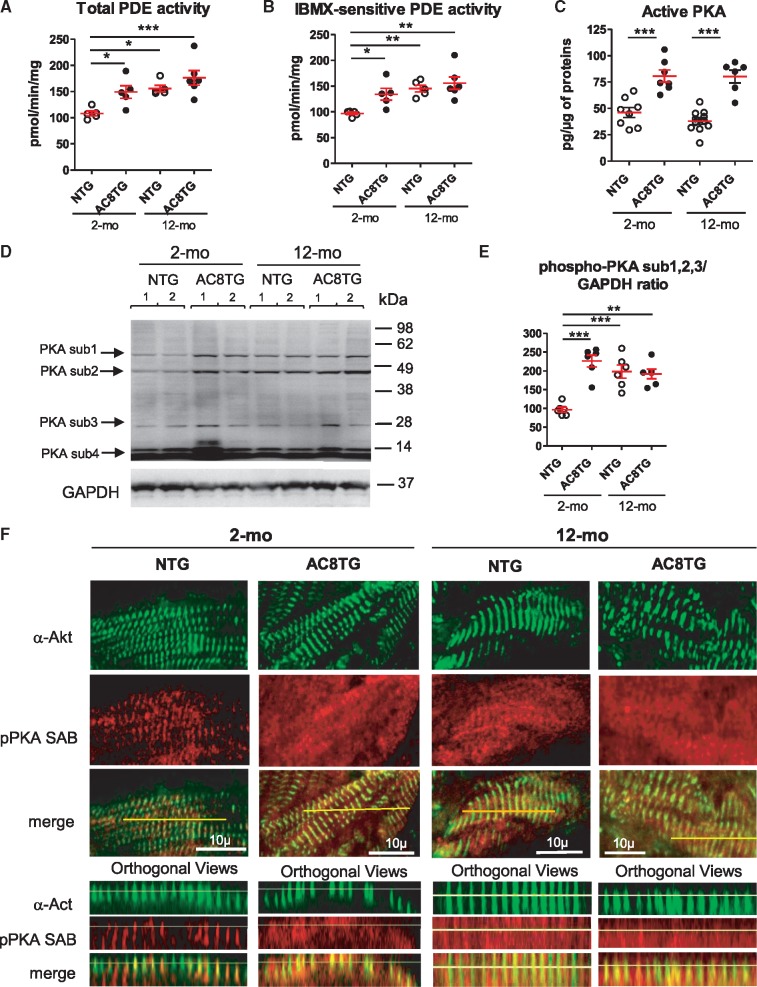
Altered localization of phospho-PKA substrates in the cardiomyocytes of AC8TG and ageing NTG animals. (A–C) Scatter plots showing the total (A) and IBMX-sensitive (B) cardiac PDE activity and basal cardiac PKA activity (C) in 2- and 12-month-old NTG (○) and AC8TG (●) mice. (D and E) Typical immunoblot (D) for the visualization of numerous of PKA substrates differently phosphorylated within 2-month-old NTG and 12-month-old NTG or AC8TG animals. Expression of three phosphorylated PKA-substrates (1, 2, and 3) was quantified in different groups of mice and normalized to GAPDH (E). The horizontal line indicates the mean value for each group. Eight to 10 animals were analysed in each group. *P < 0.05; **P < 0.01; ***P < 0.001 (one-way ANOVA followed by Newman–Keuls post hoc test). (F) Confocal immunofluorescence of phospho-PKA substrate on snap-frozen cardiac cross sections. Scale bars: 10 µm. Position of Z-lines, corresponding to T-tubule/junctional reticulum space, are indicated by alpha-actinin (α-Act) labelling (green). Z-line interspace corresponded to LR containing SERCA2a/PLN. Preferential localizations of phosphorylated PKA substrates are indicated by labelling with anti-phospho-PKA substrate antibody (red). Line indicates the position of orthogonal views for each section. Three animals from each group were analysed.

