
Fig. 5.
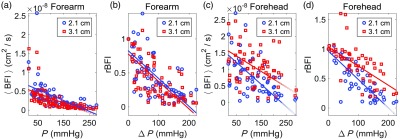
(a) Steady-state (mean) DCS blood flow index () measurements obtained at 2.1 cm (blue circles) and 3.1 cm (red squares) separations on the forearm plotted against external probe pressure () ( pressures total divided across 11 healthy adults; 1 min of DCS data per pressure). (b) Corresponding intrasubject normalized relative changes in the mean DCS blood flow index plotted against changes in probe pressure on the forearm. (c) measurements obtained at 2.1- and 3.1-cm separations on the forehead plotted against ( pressures total). (d) Corresponding rBFI data plotted against on the forehead. The solid lines are the best fits to the data from linear mixed effects regression analysis (the slopes and intercepts, as well as Pearson’s correlations, are reported in Table 2). and denote the subject’s mean steady-state blood flow index and probe pressure measured at the baseline (initial) probe pressure. The slopes of the lines on the forearm at 2.1 cm are not significantly different from those at 3.1 cm. On the forehead, in contrast, the magnitudes of the slopes at 3.1 cm are significantly smaller than those at 2.1 cm.