
Figure-1.
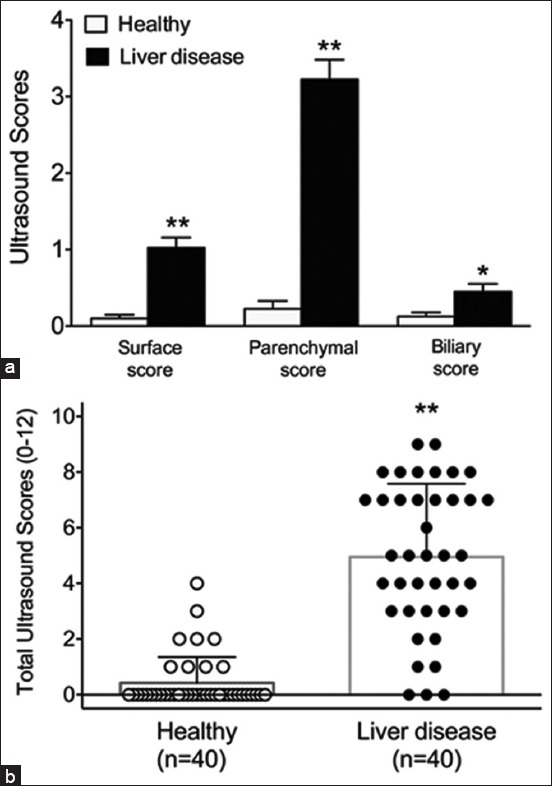
Ultrasound scores of the healthy and diseased group. (a) Histogram illustrating the average scores of each ultrasound criterion of the healthy and diseased group. (b) Scatter plot illustrating the total ultrasound criterion of the healthy and diseased group. *p<0.05 compared to healthy group; **p<0.01 compared to healthy group.