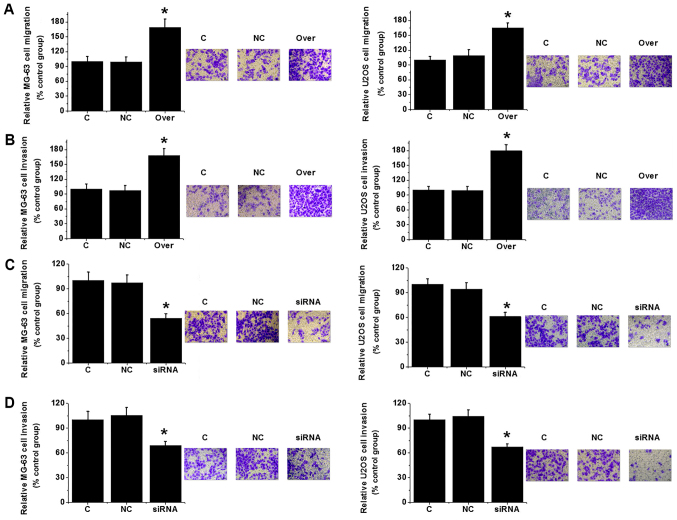
Figure 5.
Effects of TUG1 knockdown and overexpression on cell migration and invasion. (A) Migration and (B) invasion of MG-63 and U2OS cells following TUG1 overexpression. (C) Migration and (D) invasion of MG-63 and U2OS cells following TUG1 knockdown. Each experiment was repeated three times, and all data were normalized to C. *P<0.05 vs. C and NC. TUG1, taurine upregulated gene 1; C, control cells without any transfection; NC, negative control cells transfected with empty vector or negative control siRNA; Over, cells transfected with plasmid expressing TUG1.

