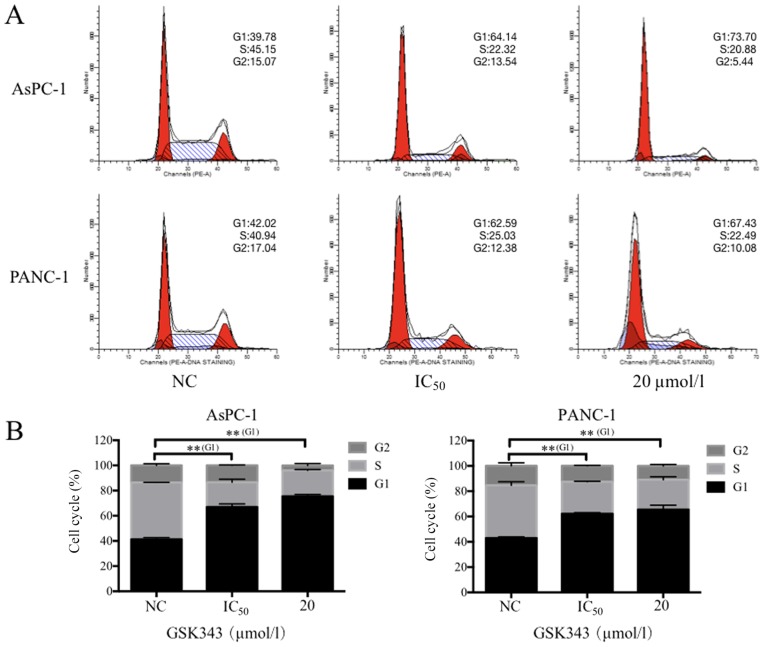
Figure 4.
GSK343 induced cell cycle arrest in the G1 phase of AsPC-1 and PANC-1 cells. (A) Flow cytometry analysis was used to detect cell cycle distribution after treatment with 0 µmol/l, IC50 and 20 µmol/l GSK343. (B) Percentage of AsPC-1 and PANC-1 cells in G1-S-G2-phase are presented as the mean ± standard deviation, **P<0.01. NC, negative control.

