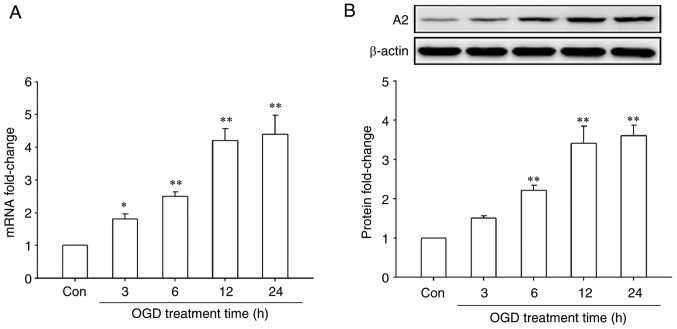
Figure 1.
Effects of treatment with OGD for different time periods on the expression of A2 in human retinal endothelial cells. Cells were cultured with serum-free and glucose-free DMEM in a hypoxic incubator chamber (1% O2, 5% CO2 and 94% N2) for the indicated times. Control cells were cultured with complete medium under normal atmospheric conditions. The expression of A2 was detected by (A) reverse transcription-quantitative PCR and (B) western blotting. *P<0.05 and **P<0.01 vs. Con group. Con, control; OGD, oxygen-glucose deprivation; A2, Annexin A2.

