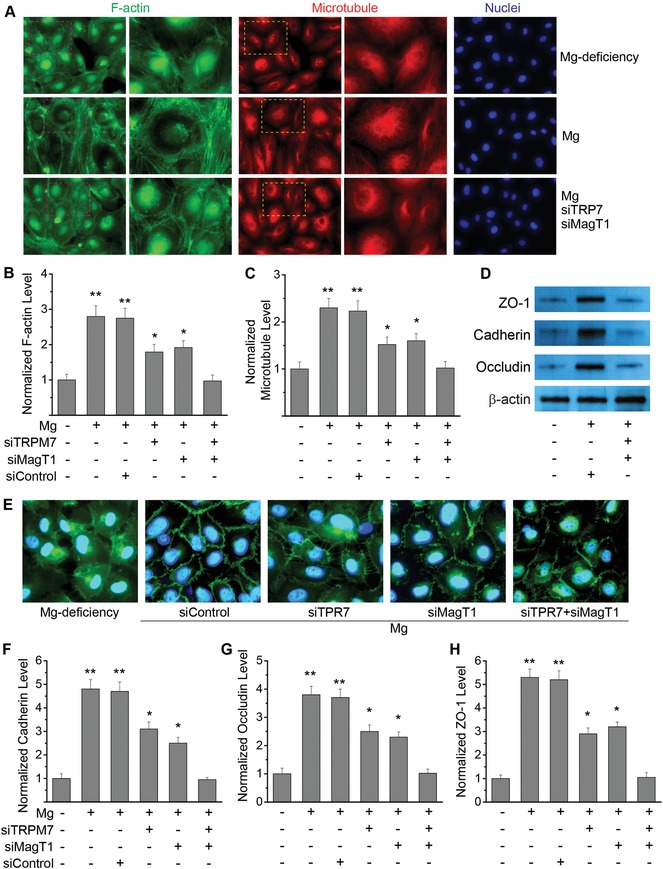
Figure 8.

Mg2+ regulates endothelial cytoskeletal reorganization and junction proteins. A) Representative fluorescent images of endothelial cells stained with F‐actin (green), microtubule (red), and nuclei (blue) with Mg2+‐deficiency (0.1 mmol L−1) and Mg2+‐treatment (2 mmol L−1) with or without siRNA against both MagT1 and TRPM7. Regions in red or yellow were enlarged in higher magnification. B) Quantitative measurements of normalized F‐actin level in each cell as compared to Mg2+‐deficiency with or without siRNA against MagT1 and/or TRPM7. C) Quantitative measurements of normalized microtubule level in each cell as compared to Mg2+‐deficiency with or without siRNA against MagT1 and/or TRPM7. D) Western blot analysis showing the expression of cadherin, occluding and ZO‐1 with Mg2+‐deficiency (0.1 mmol L−1) and Mg2+‐treatment (2 mmol L−1) with or without siRNA against both MagT1 and TRPM7. E) Representative fluorescent images of endothelial cells stained with cadherin (green) and nuclei (blue) with Mg2+‐deficiency and Mg2+‐treatment with siRNA against MagT1 and/or TRPM7. F) Quantitative measurements of normalized cadherin level in each cell as compared to Mg2+‐deficiency with or without siRNA against MagT1 and/or TRPM7. G) Quantitative measurements of normalized occludin level in each cell as compared to Mg2+‐deficiency with or without siRNA against MagT1 and/or TRPM7. H) Quantitative measurements of normalized ZO‐1 level in each cell as compared to Mg2+‐deficiency with or without siRNA against MagT1 and/or TRPM7. (*P < 0.05, vs Mg2+‐deficiency or group treated with MagT1 siRNA and TRPM7 siRNA; **P < 0.01, vs Mg2+‐deficiency or group treated with MagT1 siRNA and TRPM7 siRNA; n = 4).
