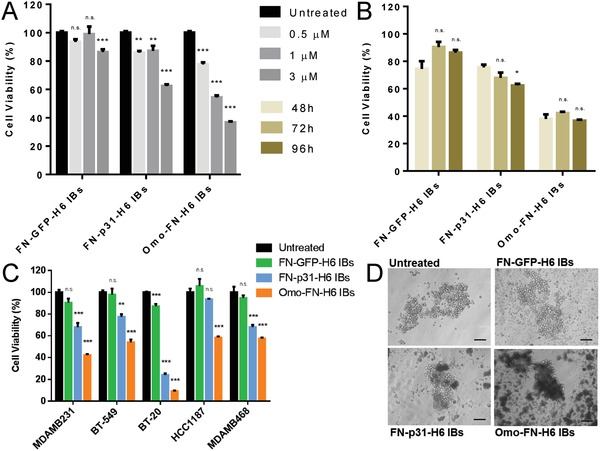
Figure 2.

Biological impact of IBs on cultured cells. A) Dose‐dependent loss of MDA‐MB‐231 cell viability upon exposure to IBs for 96 h. At 9 × 10⁻⁶ m, background reduction of cell viability was observed in cells exposed to GFP‐based IBs (not shown). B) Time‐dependent loss of MDA‐MB‐231 cell viability upon exposure to IBs (3 × 10⁻⁶ m). C) Killing of different CD44+ cell lines by cytotoxic IB (3 × 10⁻⁶ m), upon exposure for 96 h. D) Representative bright field images of MDA‐MB‐231 tumor‐spheres upon addition of 3 × 10⁻⁶ m protein and further incubation for 72 h. Qualitative assessment of sphere morphology and integrity when challenged with p31 and Omomyc IBs, compared to an equivalent GFP construct. Magnification bars represent 100 µm. One‐way ANOVA and a post‐hoc Dunnett test was performed comparing all groups to PBS‐treated control cells. p > 0.05 (n.s.); p < 0.05 (*); p < 0.01 (**); p < 0.001 (***).
