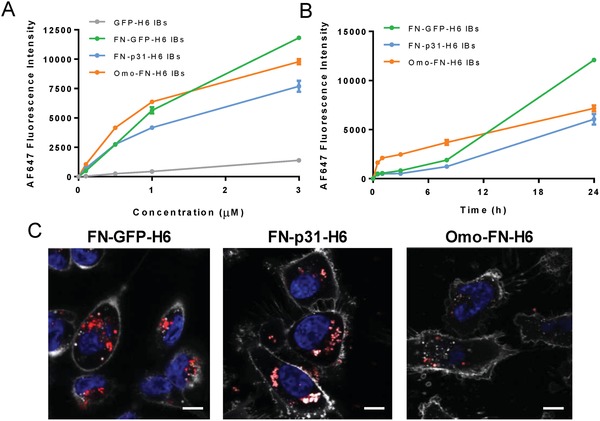
Figure 3.

Cell penetration of CD44‐targeted IBs. A) Quantification of protein internalization by fluorescence was quantified with flow cytometry into MDA‐MB‐231 cells incubated for 24 h at increasing concentration of IBs. B) Kinetics of IB penetration into MDA‐MB‐231 cells exposed to 3 × 10⁻⁶ m IBs. C) Representative confocal microscopy images of protein internalization in MDA‐MB‐231 after 24 h treatment with 3 × 10⁻⁶ m of IBs. Nuclei and membrane cells were labeled with Hoechst (blue) and WGA (light grey) respectively. Magnification bars represent 5 µm.
