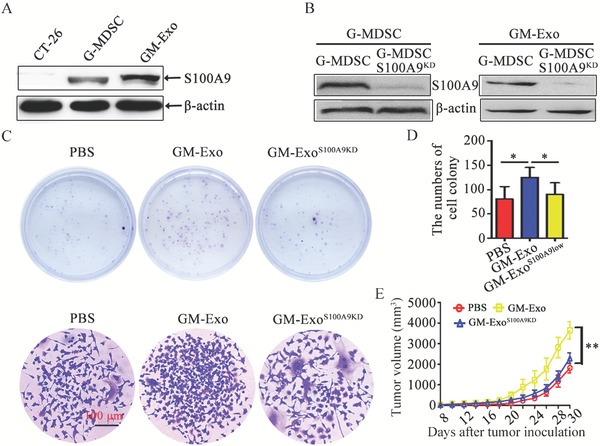
Figure 3.

GM‐Exo promotes CT‐26 cell growth through S100A9. A) Representative western blot of S100A9 expression in GM‐Exo. B) Representative western blot analysis of S100A9 expression in G‐MDSCs and GM‐Exo treated with S100A9 siRNA or left untreated (representative result of three independent experiments). C) Representative images of cell colonies (Top) and a single colony (Bottom) in CT‐26 cells treated with PBS, GM‐Exo, or GM‐ExoS100A9KD for 14 days. D) Colonies with more than 100 cells were quantified. E) The tumor volume was determined every 2 days. CT‐26 cells were treated with PBS, GM‐Exo, or GM‐ExoS100A9KD for 14 days, and 1 × 10⁶ cells were subcutaneously injected into the right flank of BALB/c mice. The tumor length (L) and width (W) were measured with a caliper, and tumor volumes were calculated. Data are shown as the mean ± SEM of each group (n = 6) pooled from three independent experiments. *p < 0.05 and **p < 0.01, analyzed by ANOVA.
