Figure 2.

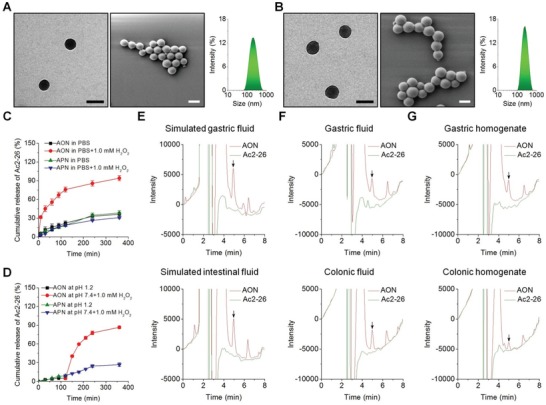
Characterization of Ac2‐26 nanotherapies. The TEM images (left), SEM micrographs (middle), and size distribution profiles (right) of A) AON and B) APN. Scale bars, 200 nm. C) In vitro release profiles of Ac2‐26 nanotherapies AON and APN in 0.01 m PBS at pH 7.4 with or without 1.0 × 10⁻³ m H2O2. D) Ac2‐26 release in buffers simulating the gastrointestinal pH conditions. Chemical stability of Ac2‐26 before and after loading into OxbCD NP and incubated in different solutions, including E) simulated gastric or intestinal fluids, F) gastric or colonic lavage fluids, and G) gastric or colonic homogenates. Data in (C) and (D) are presented as mean ± SE (n = 3).
