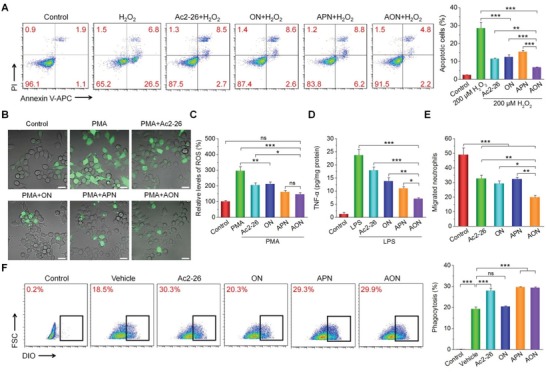
Figure 7.

In vitro antioxidation and anti‐inflammatory activities of AON. A) H2O2‐induced apoptosis of macrophages shown by flow cytometry plots (left) and corresponding quantitative analysis (right). Before exposure to 200 × 10−6 m H2O2 for 12 h, macrophages were preincubated with different formulations for 4 h. B) Fluorescence microscopy images showing the intracellular generation of ROS in macrophages stimulated with 100 ng mL−1 of PMA and treated with different formulations for 4 h. DCFH‐DA was used as a fluorescent probe to stain intracellular ROS. Scale bars, 20 µm. C) The relative ROS levels in macrophages quantified by flow cytometry. Cells were treated with the same procedures as for fluorescence microscopy. D) The expression levels of TNF‐α in macrophages after different treatments. Macrophages were preincubated with different formulations for 6 h, and then exposed to 100 ng mL−1 of LPS for 12 h before quantification of TNF‐α. E) Quantitative results of migrated neutrophils in the lower chamber of the Transwell system after treatment with different formulations. F) Phagocytosis of apoptotic neutrophils by macrophages shown by flow cytometry (left) and corresponding quantitative analysis (right). Macrophages were exposed to vehicle, Ac2‐26, ON, APN, or AON for 1 h before the addition of labeled apoptotic neutrophils. In the control group, no apoptotic neutrophils were added. Data are presented as mean ± SE (n = 3). *p < 0.05, **p < 0.01, ***p < 0.001; ns, no significance.
