Figure 5.

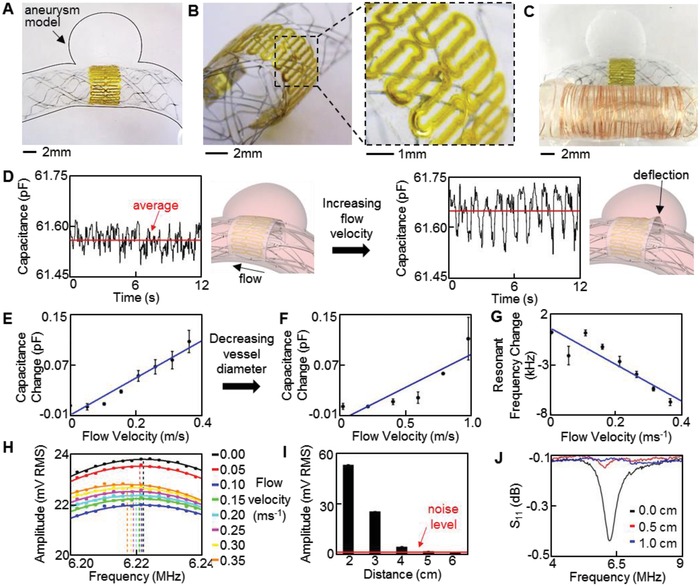
In vitro study of the printed sensor performance in a biomimetic blood vessel model. A–C) Photos of a medical stent‐integrated sensor in an aneurysm model, showing A) a zoomed‐out overview of the sensor, B) tilted, zoomed‐in view of the ultrathin, low‐profile sensor, and C) a copper coil connected sensor for wireless monitoring of hemodynamics in the biomimetic model. D) Pulsatile flow velocity captured by the sensor; average sensor capacitance increases with flow velocities from 0.05 (left) to 0.35 m s−1 (right). Illustration (right) indicates mechanism of capacitance change due to increased flow into aneurysm. E,F) Average capacitance change with the increase of E) flow velocity in the 5 mm vessel and F) higher flow velocities in the 3.5 mm vessel. G) Decreased resonant frequency with increased flow velocity. H) Continuous frequency sweeps, showing the shift in resonant frequency. I) Decreased peak amplitude at resonance with the increased distance; 6 cm interrogation distance is achieved before a resonance peak is not observable. J) Lowered readout distance (less than 1 cm) in monitoring of resonant frequency with a VNA, indicating superiority of the optimized wireless inductive coupling method.
