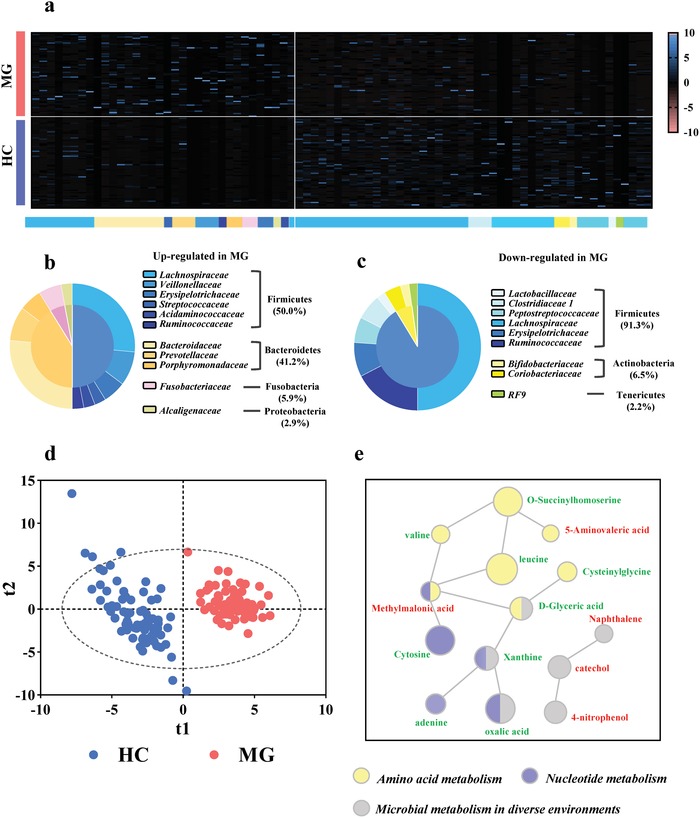
Figure 2.

Gut microbial characteristics of MG. a) Using linear discriminant analysis (LEfSe), 80 differential OTUs responsible for discriminating the gut microbiota in MG and HCs subjects were identified. Heatmap of the 80 discriminative OTUs abundances between MG subjects and healthy controls; b,c) 34 upregulated OTUs in MG are arranged on the left, while 46 decreased OTUs are arranged on the right. The taxonomic assignment of each OTU is provided on the above of Heatmap. Most of the upregulated OTUs belongs to Firmicutes (50.0%), Bacteroidetes (41.2%) and Fusobacteria (5.9%), while downregulated OTUs mainly belongs to Firmicutes (91.3%) and Actinobacteria (6.5%). d) The Partial least‐squares discriminant analysis (PLS‐DA) scores plot showing a clear discrimination between MG subjects and HCs. e) The key disturbed metabolic pathways in MG. The red label indicates the increased metabolites, while the green label indicates the decreased metabolites in MG subjects relative to HCs. The p‐value of each metabolite is represented by the circle area. IPA software analysis showed that MG was mainly associated with disturbances of amino acid metabolism, nucleotide metabolism and microbial metabolism in diverse environments. (n = 74, HC; n = 70, MG).
