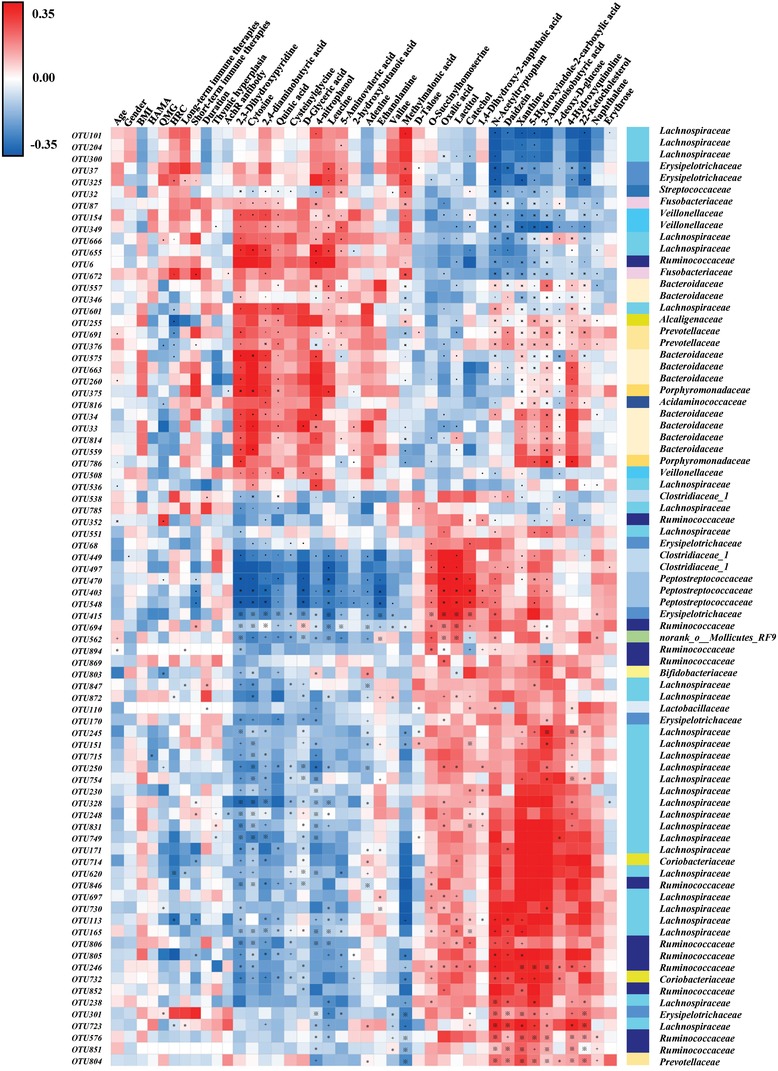
Figure 3.

Associations of gut microbial species with fecal metabolites and clinical indexes. Heat map of the Spearman's rank correlation coefficient of 80 gut microbial OTUs and 30 metabolites as well as 11 clinical indexes. Red squares indicate positive associations between these microbial species and metabolites or clinical indexes; blue squares indicate negative associations. The statistical significance was denoted on the squares (*p < 0.05; +p < 0.01; ※p < 0.001). 31 of 80 differential microbial variances (38.75%) were significantly associated with differential metabolites (p value < 0.001 and correlation coefficient were ≥0.35 or ≤−0.35, tested by Spearman correlation). Moreover, some gut microbial OTUs were slightly associated with some clinical parameters such as gender, HAMA, long‐term immune therapies, duration, thymic hyperplasia and well‐established acetylcholine receptor (AchR) antibody, but highly linked with indicators of MG severity (QMG score, HRC, and short‐term immune therapies). Abbreviation: BMI, body mass index; HAMA, Hamilton anxiety scale; QMG, quantitative myasthenia gravis; HRC, history of respiratory crisis.
