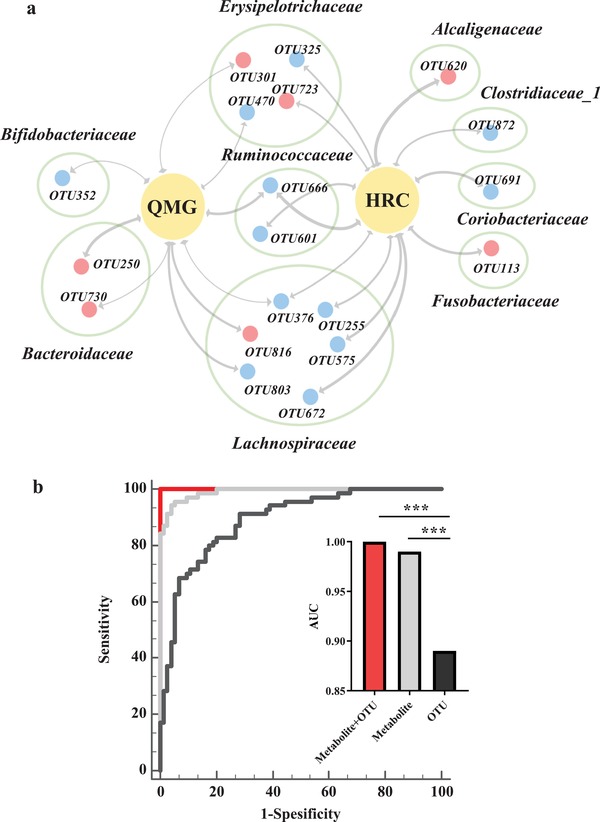
Figure 4.

Microbial and metabolite markers for MG. a) the association between MG severity and microbial OTUs. 21 OTUs were significantly linked with MG severity (QMG score and HRC). Majority of these OTUs mainly belonged to Lachnospiraceae (6 OTUs), Erysipelotrichaceae (4 OTUs), and Bacteroidaceae (2 OTUs) at family level. Red dots indicate the upregulated microbial OTUs, while blue dots indicate the downregulated OTUs in MG related to HCs. The thickness of the line represents the size of the p‐value (p < 0.05). b) diagnostic markers for MG: Combination of 4 microbial marker (Clostridiaceae 1, Lachnospiraceae, Erysipelotrichaceae, and Bacteroidaceae) and 6 metabolites (leucine, cytosine, oxalicacid, N‐Acetyltryptophan, d‐Glyceric acid, and xanthine) can distinguish the MG from HCs with an area under the curve (AUC) of 1 (accuracy of 100%), which was significantly higher than that of separate microbial or metabolic markers.
