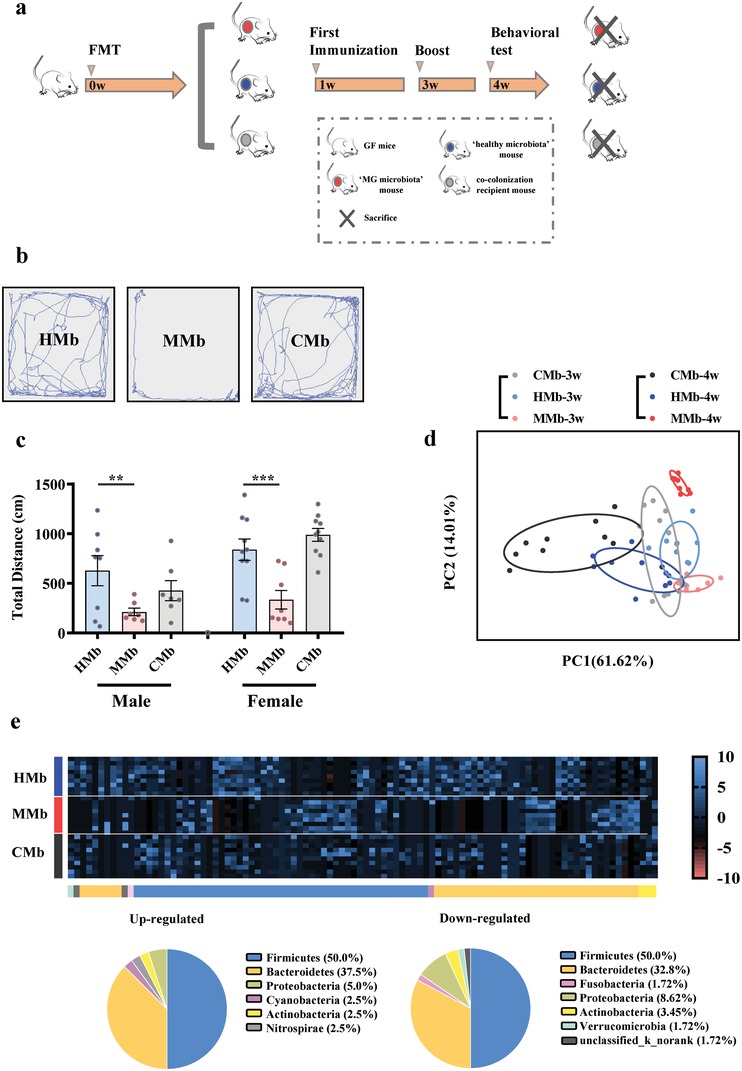
Figure 5.

a) The workflow of fecal microbiota transplant (FMT) experiment. Briefly, adult male a germfree (GF) Kunming mice were colonized with fecal samples derived from MG patients or healthy controls, thus generating the “MG microbiota” recipient mice(MMb) and “healthy microbiota” recipient mice (HMb). Moreover, to further verify the effect of gut microbiome on behavior, an independent GF mice group was simultaneously colonized with fecal samples from both MG and HC to generate the cocolonization recipient mice. Three groups were immunized twice at second and fourth weeks. The Openfield test (OFT) was performed at fifth weeks. To verify the generality of the results, we conducted two separate experiments using both female and male GF mice. b,c) Representative motion tracks for a “MG microbiota” mouse (MMb), a “healthy microbiota” mouse (HMb) and a cocolonization recipient mouse (CMb). The total motion distance of “MG microbiota” was substantially decreased compared to of that in “healthy microbiota” recipient mice, and showed no significant differences with that in cocolonization recipient mice. The consistent results were observed while using the male and female GF mice in the two independent experiments (n = 8/HMb male group, n = 7/MMb male group, n = 7/CMb male group; n = 10/HMb female group, n = 8/MMb female group, n = 10/CMb female group). Data presented as means ± standard error of mean. * p < 0.05, **p < 0.01, ***p < 0.001 by one‐way ANOVA. d) At the operational taxonomic units (OTU) level, principal component analysis showed that gut microbiota composition of “MG microbiome” recipient mice was significantly different from that in healthy controls. e) Using linear discriminant analysis (LEfSe), 98 differential OTUs responsible for discriminating the gut microbiota in MMb and HMb mice were identified. Heatmap of the 98 discriminative OTUs abundances between MG subjects and healthy controls; 40 upregulated OTUs in MMb mice are arranged on the left part of the image, and 58 decreased OTUs are arranged on the right part. The taxonomic assignment of each OTU is provided on the above of Heatmap. (n = 10, HMb; n = 8, MMb; n = 10, CMb).
