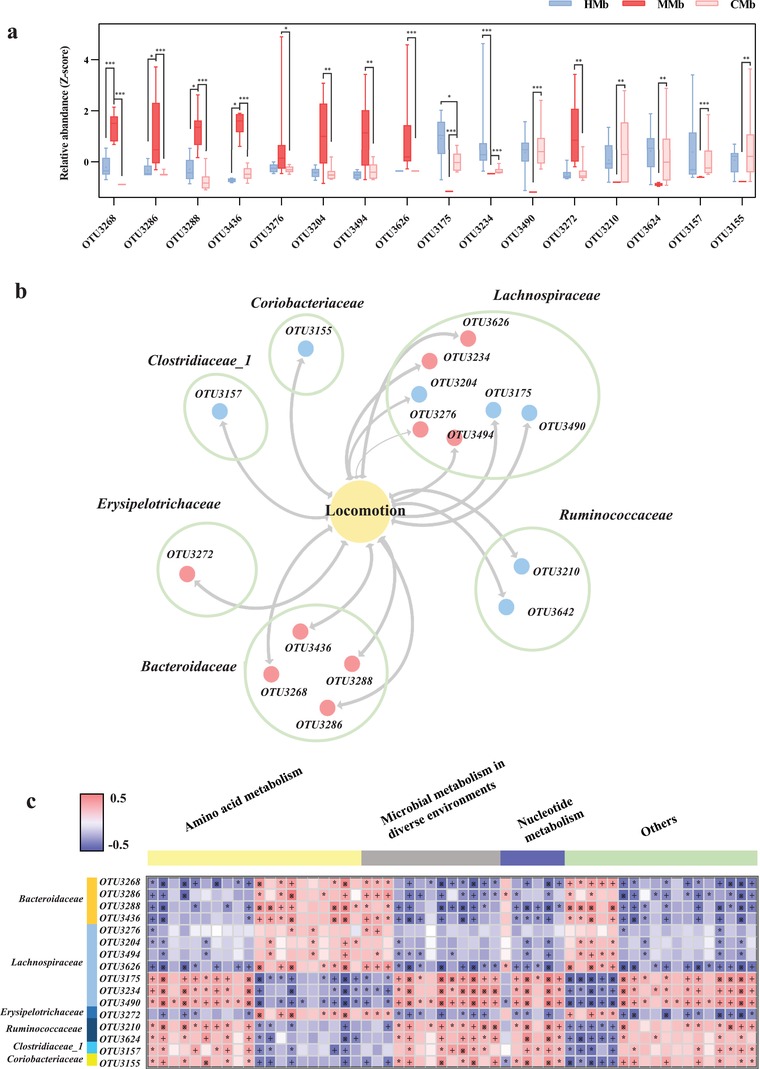
Figure 6.

Gut microbial characteristics of MMb mice. a,b) 16 of 54 reversed OTUs mainly belonging to Lachnospiraceae (7 OTUs), Bacteroidaceae (4 OTUs), and Ruminococcaceae (2 OTUs) were linked with the total motion distance in the OFT (n = 10, HMb; n = 8, MMb; n = 10, CMb). This finding was highly similar with what had been observed in analysis of correlation between altered microbes and MG severity. Red dots indicate the upregulated microbial OTUs, while blue dots indicate the downregulated OTUs in MMb mice related to HMb mice, the thickness of the line represents the size of the p‐value (p < 0.05). c) Associations of gut microbial OTUs with fecal metabolites. Heat map of the Spearman's rank correlation coefficient of 16 gut microbial OTUs and 57 metabolites. The MMb mice was characterized by changes of amino acid metabolism, nucleotide metabolism and microbial metabolism in diverse environments. Red squares indicate positive associations between these microbial OTUs and metabolites; blue squares indicate negative associations (n = 9, HMb; n = 8, MMb). The statistical significance was denoted on the squares (*p < 0.05; +p < 0.01; ※p < 0.001).
