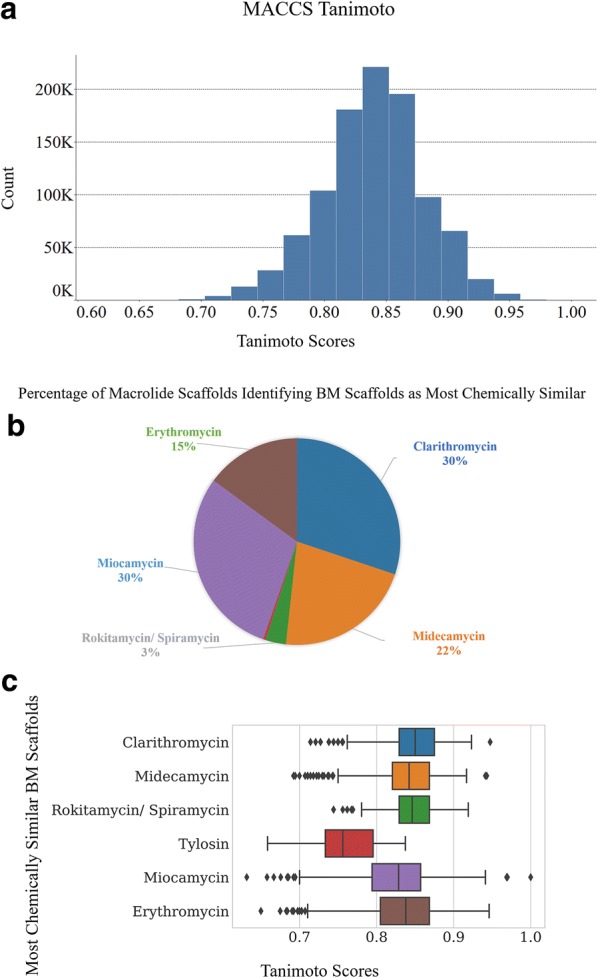
Fig. 10.

Calculation of Tanimoto similarity scores between V1M and the 18 BM scaffolds as probe molecules using MACCS Fingerprint and maximum aggregation method. a Highest Tanimoto distribution of V1M. Number of macrolide scaffolds in V1M identifying eight BM scaffolds as highest chemically similar; b pie chart with count of macrolide scaffolds reported as percentage of the population; c box plot analysis of eight BM scaffolds with associated Tanimoto score distributions
