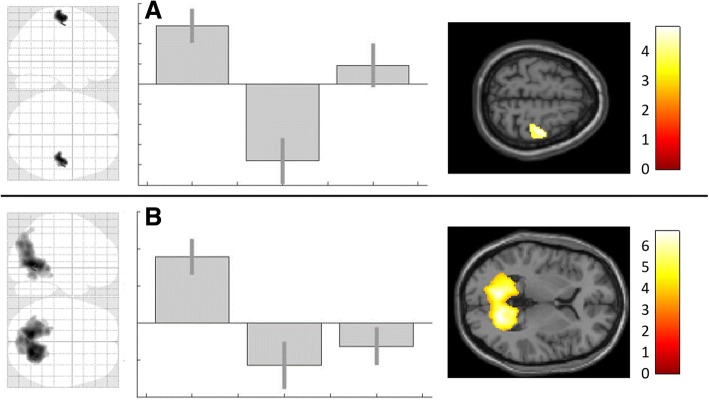
Fig. 3.
Polarity dependent effect of tDCS on visual and motor processing. Significant (pFWE < .05) alterations of BOLD-response after DCS (postcathodal vs. postanodal) for A. motor- (precentral-gyrus), and B visual-processing (calcarine-gyrus). Illustrated as SPM generated glass-brain and T1-overlay; for better visualization both displayed with a threshold of punc < .0005. Corresponding contrast estimates in the following order: 1. postcathodal, 2. postanodal and 3. postsham. For coordinates and further details see Table 3

