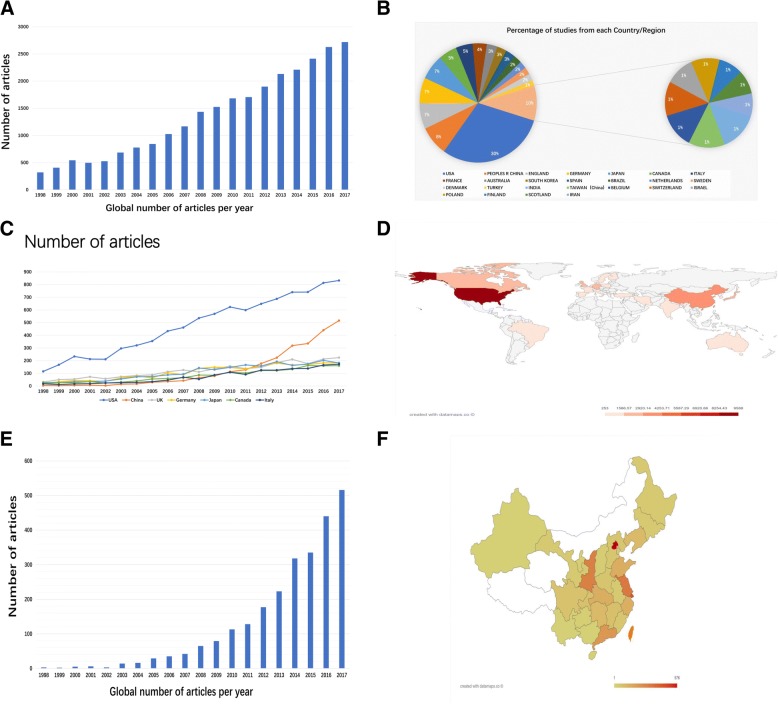
Fig. 1.
Neuropathic pain related articles in world and in China (a) The global number of neuropathic pain publications. The blue bars indicate the quantity of neuropathic pain articles. (b) Percentage of studies from each Country/Region. (c) The time curve of neuropathic pain articles from top 7 countries. (d) The heat map showing the distribution of neuropathic pain publications in world. (e) The annual number of neuropathic pain articles in China. (f) The heat map showing the distribution of neuropathic pain publications in China

