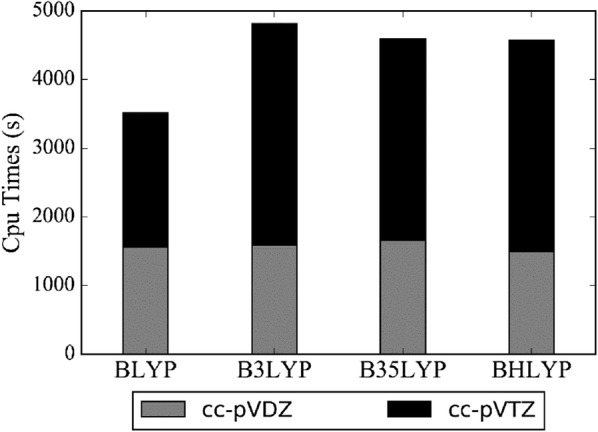
Fig. 4.

Computational costs of DFT methods performed for the demonstration set. Each bar is for two DFT methods with basis sets of cc-pVDZ and cc-pVTZ. The grey bars represent CPU times for the methods with cc-pVDZ and the black bars represent those with cc-pVDZ and the black bars represent those with cc-pVTZ
