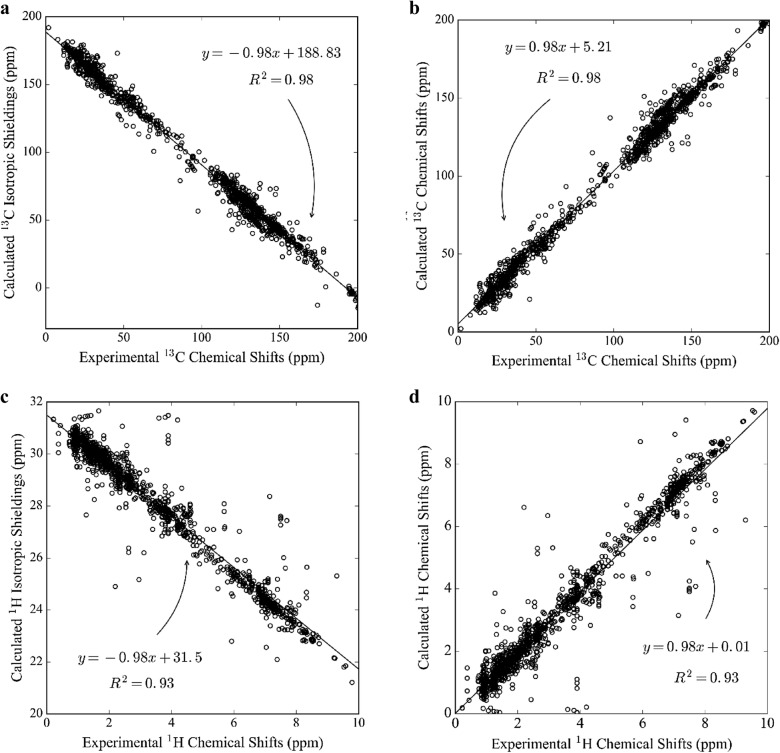
Fig. 5.
Linear correlation plots of a 13C and c 1H isotropic shielding values, and b 13C and d 1H NMR chemical shifts versus experimental NMR chemical shifts. Chemical shifts are calculated using the GIAO/B3LYP/cc-pVDZ//B3LYP/6-31G(d) level of theory for the demonstration set in CDCl3 (312 molecules (1554 carbons and 1830 hydrogens)). R2 indicates the correlation coefficient

