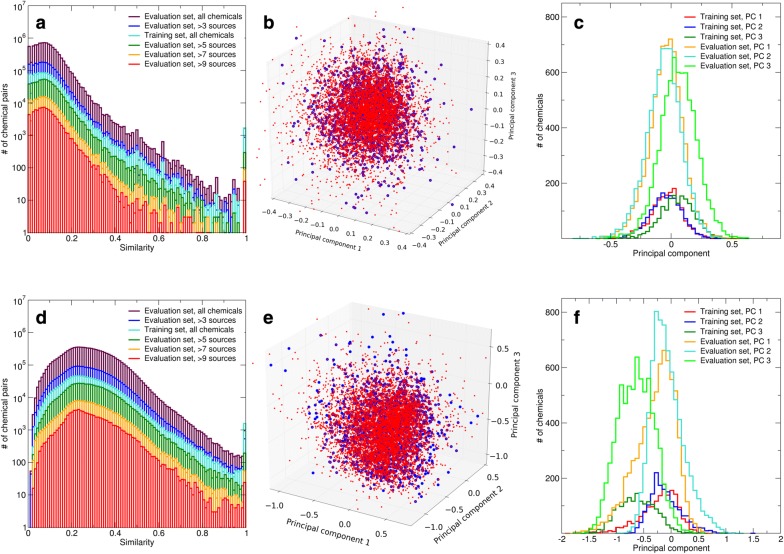
Fig. 1.
Chemical space domains occupied by the training set and the evaluation set. Results shown in panels a–c were calculated using Morgan fingerprints and Tanimoto similarity, and results shown in panels d–f were calculated using Indigo full fingerprints and Tanimoto similarity, respectively. Panels a, d distributions of pairwise molecular similarities (overlaid plots). Panels b, e projections of the training set (blue) and the evaluation set (red) on the 3D space formed by the first three eigenvectors of the training set self-similarity matrix. Panels C and F: distributions of the training and evaluation sets along each of the first three eigenvectors

