
Fig. 7.
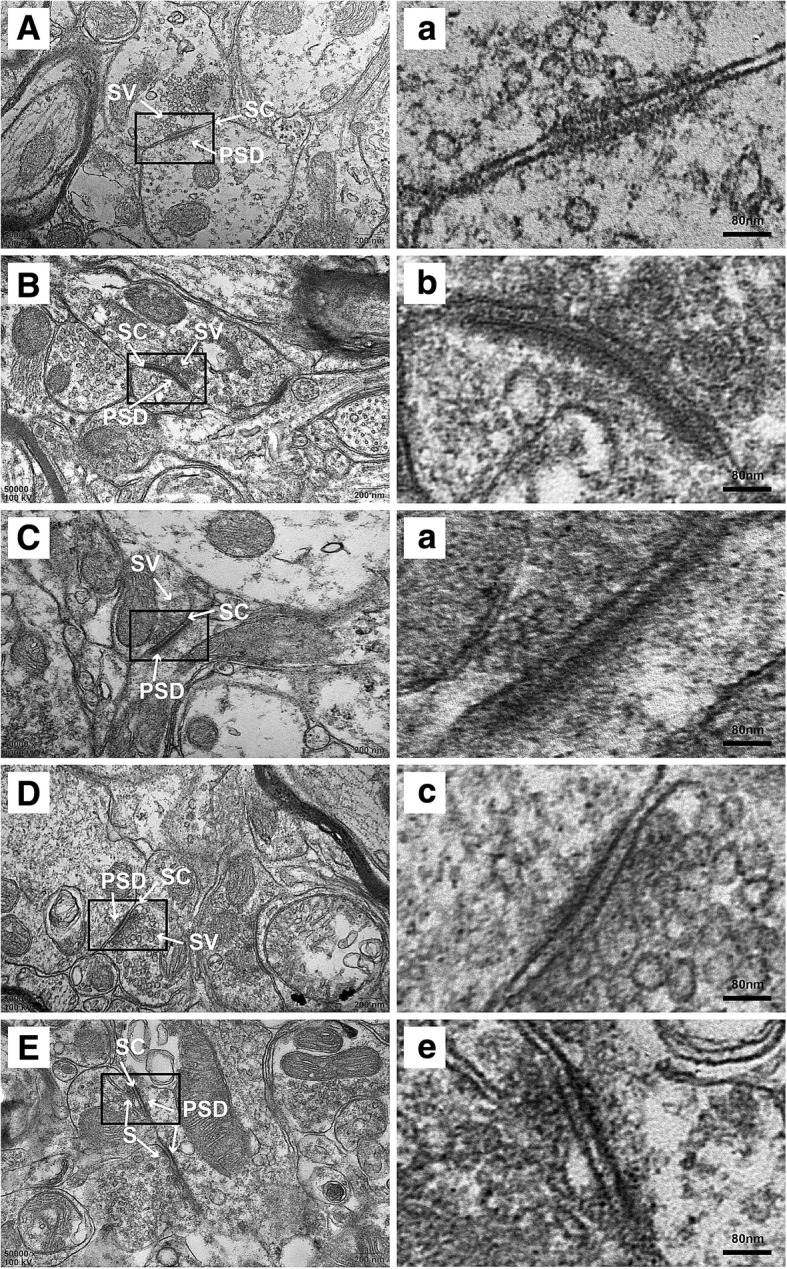
Synaptic structure of the TNC neurons in each group. a, a: sham group; b, b: CM group; c, c: CM + DMSO group; d, d: CM + PP2 group; e, e: CM + genistein group. PSD, postsynaptic density; SC, synaptic cleft; SV, synaptic vesicle. a-d show enlarged versions of the images in a-d. Scale bars = 200 nm (a-d). Scale bars = 40 nm (a-d)