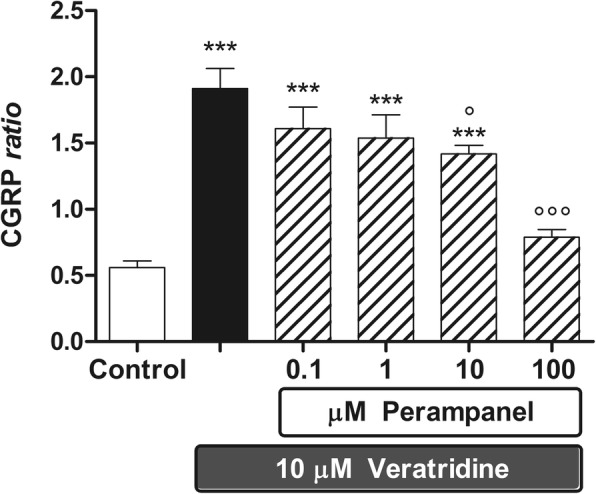
Fig. 3.

The effect of perampanel on veratridine-stimulated CGRP release from rat brainstem explants. Data are expressed as CGRP ratio (see “Materials & Methods” section), means ±1 S.E.M. of 10 replicates per group. In the figure, asterisks refer to statistical comparisons of each experimental group versus unstimulated controls, whereas circles refer to statistical comparisons of each experimental group versus secretagogue-stimulated controls. In particular, ***: p < 0.001 vs controls; ° and °°°: p < 0.05 and p < 0.001 vs veratridine given alone, respectively
