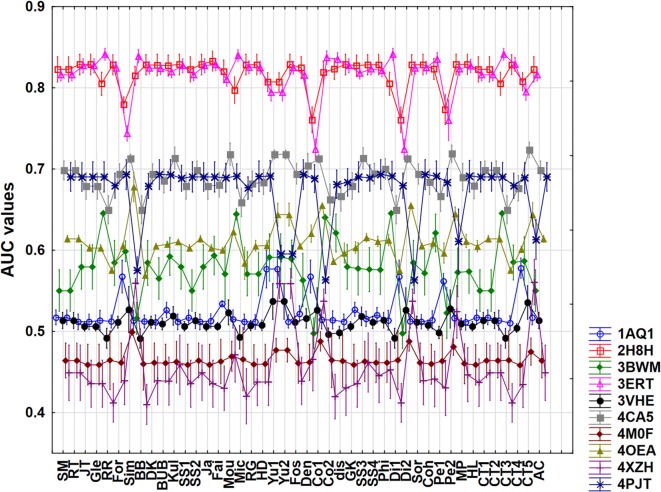
Fig. 3.
Factorial ANOVA with the use of the protein targets and the similarity measures as factors. (AUC values are plotted against the similarity metrics.) The protein targets (with PDB codes) are marked with different colors and marks on the plot. Average values (dots) and 95% confidence intervals (lines) are shown in each case

