
Figure 4.
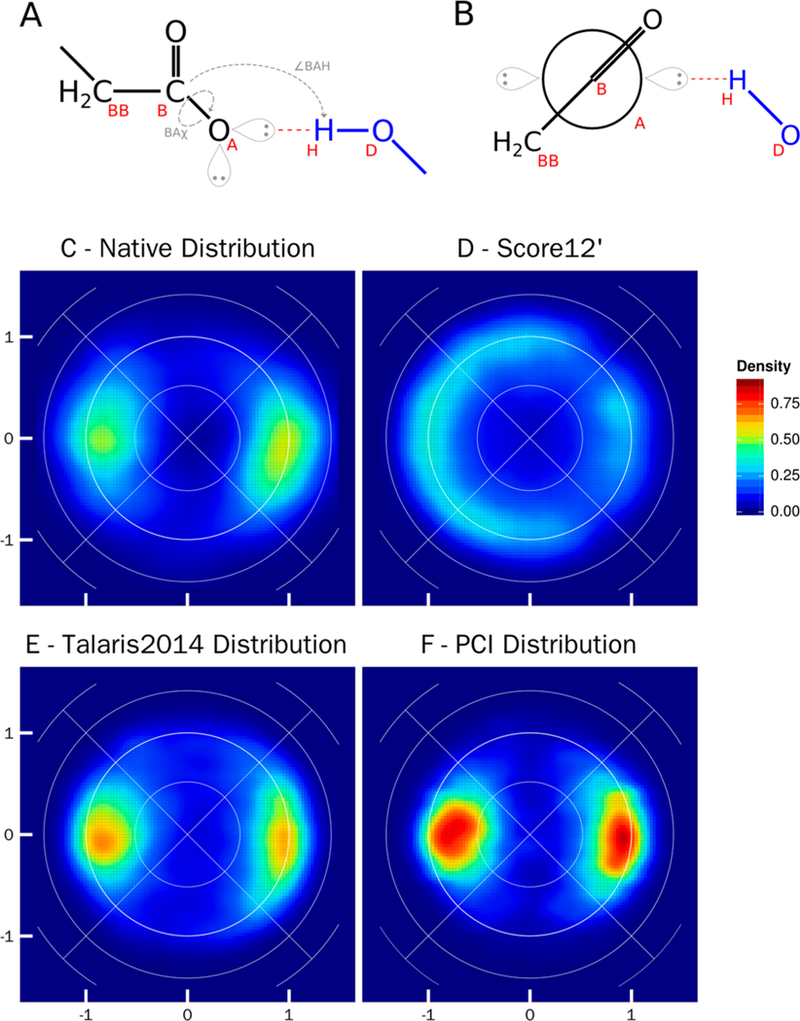
Lambert-azimuthal equal area plots for hydrogen bonds between an sp2 acceptor (O_Te2Te2TeTe) and a hydroxyl donor (O_Tr2Tr2TrPi). A) Schematic representation of parameters used to create the equal area plots: ∠BAH the angle between the acceptor base (B), the acceptor (A), and donor hydrogen atom (H); BAχ the torsional angle between the acceptor Bbase (BB), acceptor base (B), acceptor (A), and the donor hydrogen atom (H). Orbitals are shown but are not included in the geometric calculations. B) Newman projection of the hydrogen bond, looking down the axis of the BAχ torsional angle. The acceptor fragment is in black, and the donor fragment is in blue. C) Lambert-azimuthal plot of the native crystal structure distribution, high density is located directly where the orbital of an sp2 acceptor would be present. The y-axis plots 2*sin(∠BAH/2)*sin(BAχ), and the x-axis plots 2*sin(∠BAH/2)*cos(BAχ); the axes are the same for all graphs. D) Lambert-azimuthal plot of distribution post-Rosetta relax using score12’. E) Lambert-azimuthal plot of distribution post-Rosetta relax using Talaris2014. F) Lambert-azimuthal plot of distribution post-Rosetta relax using PCI.