
Figure 6.
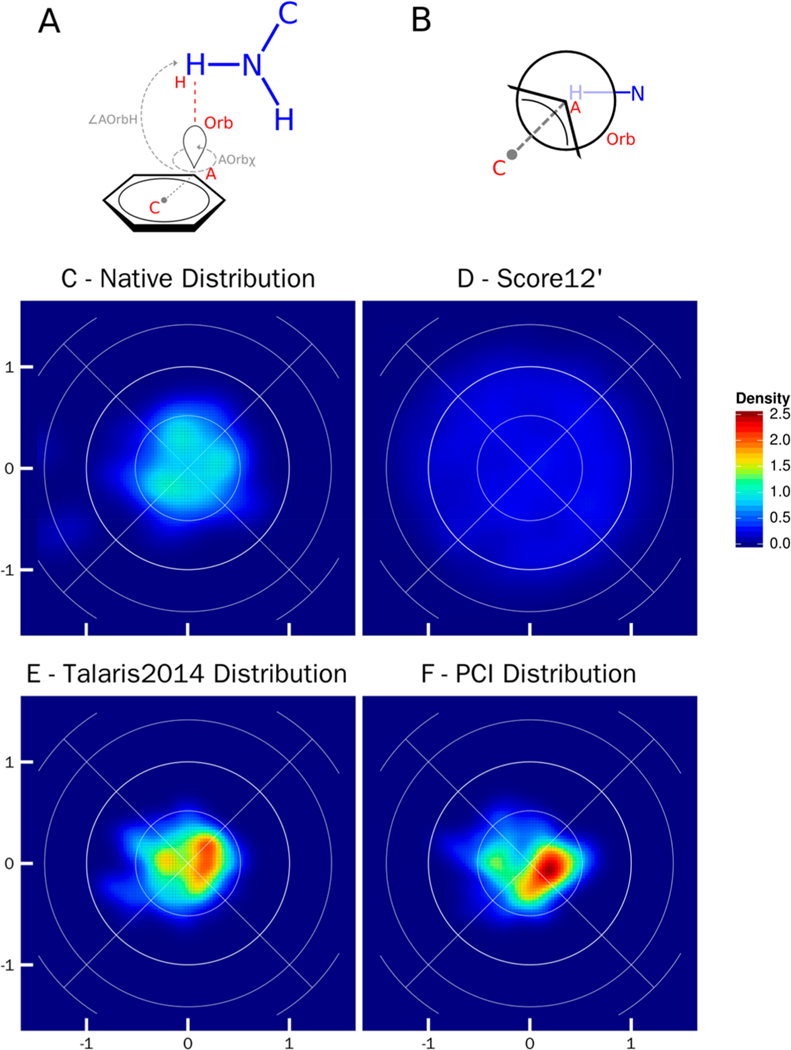
Lambert-azimuthal equal area plots for cation–π interaction between tryptophan, tyrosine, and phenylalanine (C_TrTrTrPi) and lysine and arginine (N_TrTrTrPi2). A) Schematic representation of parameters used to create the equal area plots: ∠AOrbH the angle between the acceptor (A), the orbital (Orb), and donor hydrogen atom (H); ∠Orbx the torsional angle between the ring center (C), acceptor (A), the acceptor orbital (Orb), and the donor hydrogen atom (H). B) Newman projection of the cation–π interaction, looking down the axis of the AOrbχ torsional angle. The acceptor fragment is in black, and the donor fragment is in blue. In an ideal cation–π interaction the donor hydrogen atom will lie directly in line with the acceptor and orbital. C) Lambert-azimuthal plot of the native crystal structure distribution, the x-axis is computed as 2*sin(∠AOrbH/2) * cos(AOrbχ), and the y-axis is computed as 2*sin(∠AOrbH/2) * sin(AOrbχ); all four graphs have the same axes. D) Lamber-azimuthal plot of distribution post-Rosetta relax using score12’. E) Lambert-azimuthal plot of distribution post-Rosetta relax using Talaris2014. F) Lambert-azimuthal plot of distribution post-Rosetta relax using PCI.