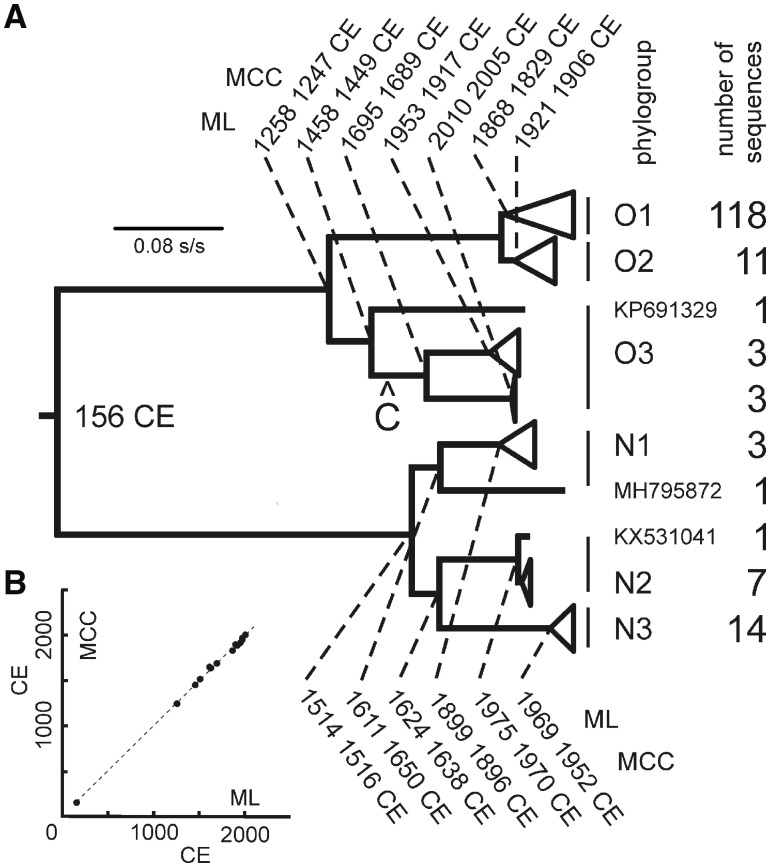
Figure 4.
Dating. (A) A cartoon illustrating an ML phylogeny of the 162 sequences used for dating. The tree was dated using a BEAST estimated TMRCA of the basal node, 1860 YBP (Table 2). Most of the clusters of the 162 sequences are collapsed. Dates of major nodes with 0.99–1.00 SH statistical support were interpolated using the mean pairwise patristic distances of all sequences connected through each node together with the TMRCA of the basal node. The dates (CE, Common Era) from the maximum likelihood (ML) and maximum clade credibility (MCC) trees are given for each significantly supported node. The mean ‘coefficient of variation’ for individual estimates was around 9 per cent. The position of the node where the C phylogroup branch was attached is marked ‘C’. (B) A graph of the estimated ML dates plotted against the estimated MCC dates.

