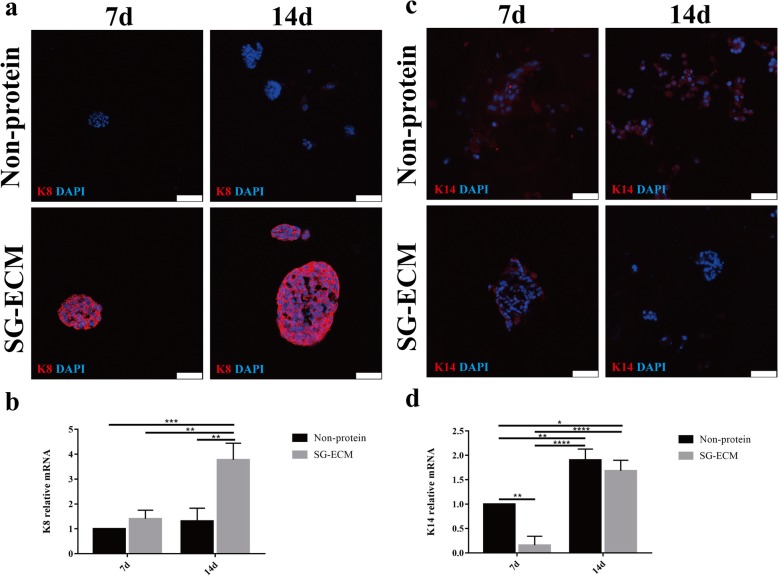
Fig. 3.
Differentiatied cells in three-dimensional (3D) bioprinted sweat gland (SG) microenvironment. a, c Immunofluorescence staining of keratin-8 (K8) and keratin-14 (K14) of inducted cells at 7 days and 14 days after bioprining (scale bar, 50 μm). b, d Gene expression of K8 and K14 in different groups. Data were presented as mean ± standard deviation (n = 3). The general difference was measured by the two-way ANOVA analysis. The comparisons between each group were analyzed by each main factor’s one-way ANOVA analysis and further the SNK-q test. *p < 0.05, **p < 0.01, ***p < 0.001

