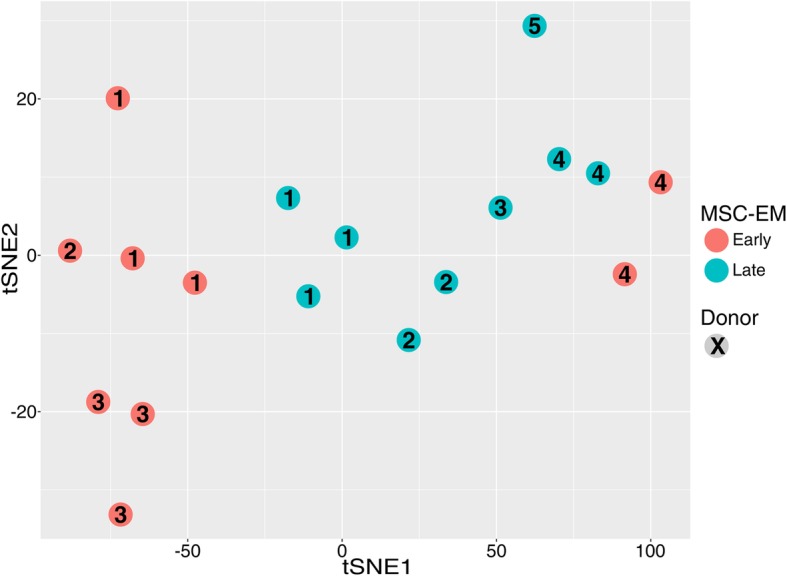
Fig. 5.

Transcriptome analysis of the different induction time points. Different induction time points were analyzed by microarray analysis. The transcriptional proximity of the samples is visualized by tSNE dimensionality reduction. All of the late (6 and 7) and most of the early time point samples (1) build separate groups. Only the first MSC from donor 4 was transcriptionally closer to late samples than to the first MSC-EMs from other donors
