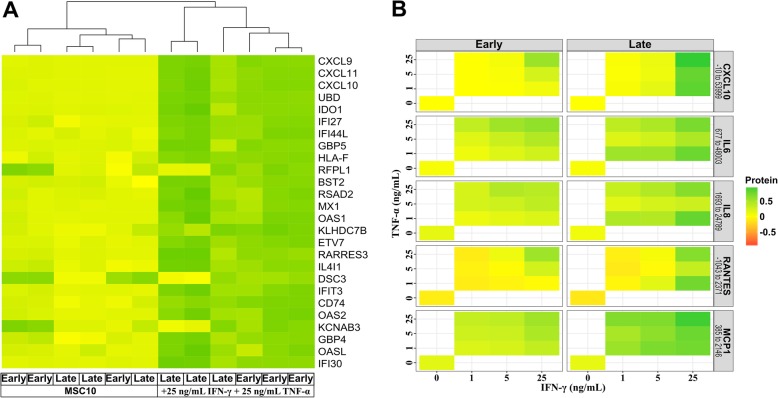
Fig. 6.
Transcriptome and secretome analyses of early and late induced MSC-EMs after activation. Early and late induced MSC-EMs were activated with IFN-γ and TNF-α for 4 days. a Heat map of the transcriptome analysis. b For conditioning, cells were washed with PBS and cultured in MSC10 for 24 h. The media were analyzed with the Bio-Plex Pro™ Human Cytokine 27-plex Assay and the 5 most deregulated cytokines are shown. Cytokines and the concentration range (pg/mL) detected are given in the column headers on the right of the graphs. A paired Wilcoxon signed-rank test was performed and confirmed significantly more produced cytokines by later induced cultures (p < 9.8e−06)

