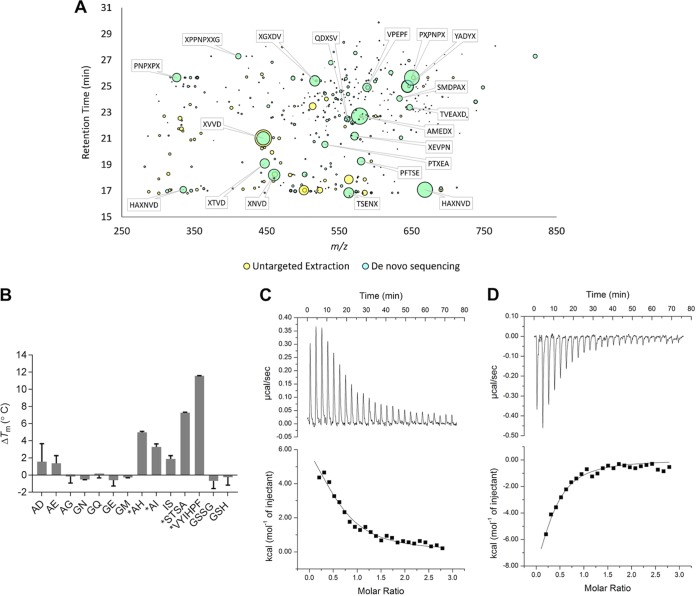
FIG 4.
Identification of ligands for HpDppA. (A) The chromatographic features uniquely identified in HpDppA by untargeted feature extraction are plotted in m/z and retention time space with the bubble size being proportional to the peak area of the chromatographic curve. The features that were also identified by de novo sequencing are shown in cyan with the most abundant annotated with their putative sequence, where X may be either leucine or isoleucine. (B) Ligand screening using thermal shift assay. Proteins and ligands were assayed at 10 μM and 2 mM concentrations, respectively. *, ΔTm > 2°C. Values shown are the means ± standard deviations (SD) from a triplicate experiment. (C and D) ITC analysis of HpDppA-peptide interactions. Top, raw titration data for VYIHPF (C) and STSA (D). Bottom, normalized integrated heat of the reaction as a function of the ligand/protein molar ratio, with the solid line showing the least-squares fit of the data to a single-site binding model. Thermodynamics parameters derived from the fitting are presented in Table 2.

